Home
Lead generation
Websites Using Any Technology AI Lead Recommender Competitor Customer Lists Technographic Data AI Cold Email + Ad Copy Churn Prediction
Store + market intelligence
Shopify Store Database Technology Market Analytics Similar Store Finder Rising Online Stores High-Ticket Product Research Trending + Low-Competition Products Niche Website Research Ad-Monetized Websites
Solutions
SaaS + Technology Vendors Lead Generation Agencies Ecommerce Market Research Store Owners Catalog Teams
Resources
Platform Guide Data Fields Reference Pricing Log in
Home/Platform guide
12 workflows · screenshots from the dashboard

The LeadsQuantum field guide

Twelve workflows that new users run in their first week. Each one starts with a single filter and ends with a list you can act on.

12Workflows
4Audiences
20+Fields per store
3Export formats
Who should read what
Store owners1, 2, 3, 9, 10
SaaS vendors4, 5, 7, 8, 12
Agencies4, 5, 6, 11
Niche builders6, 9, 10, 11
Most users get their first export inside ten minutes
Contents

Pick a workflow

01
Store ownersInvestors

Find and analyze the top stores in your vertical

Every owner wants to know what the leaders in their category do. Start from a category or a keyword and rank the result by any of 20+ metrics.

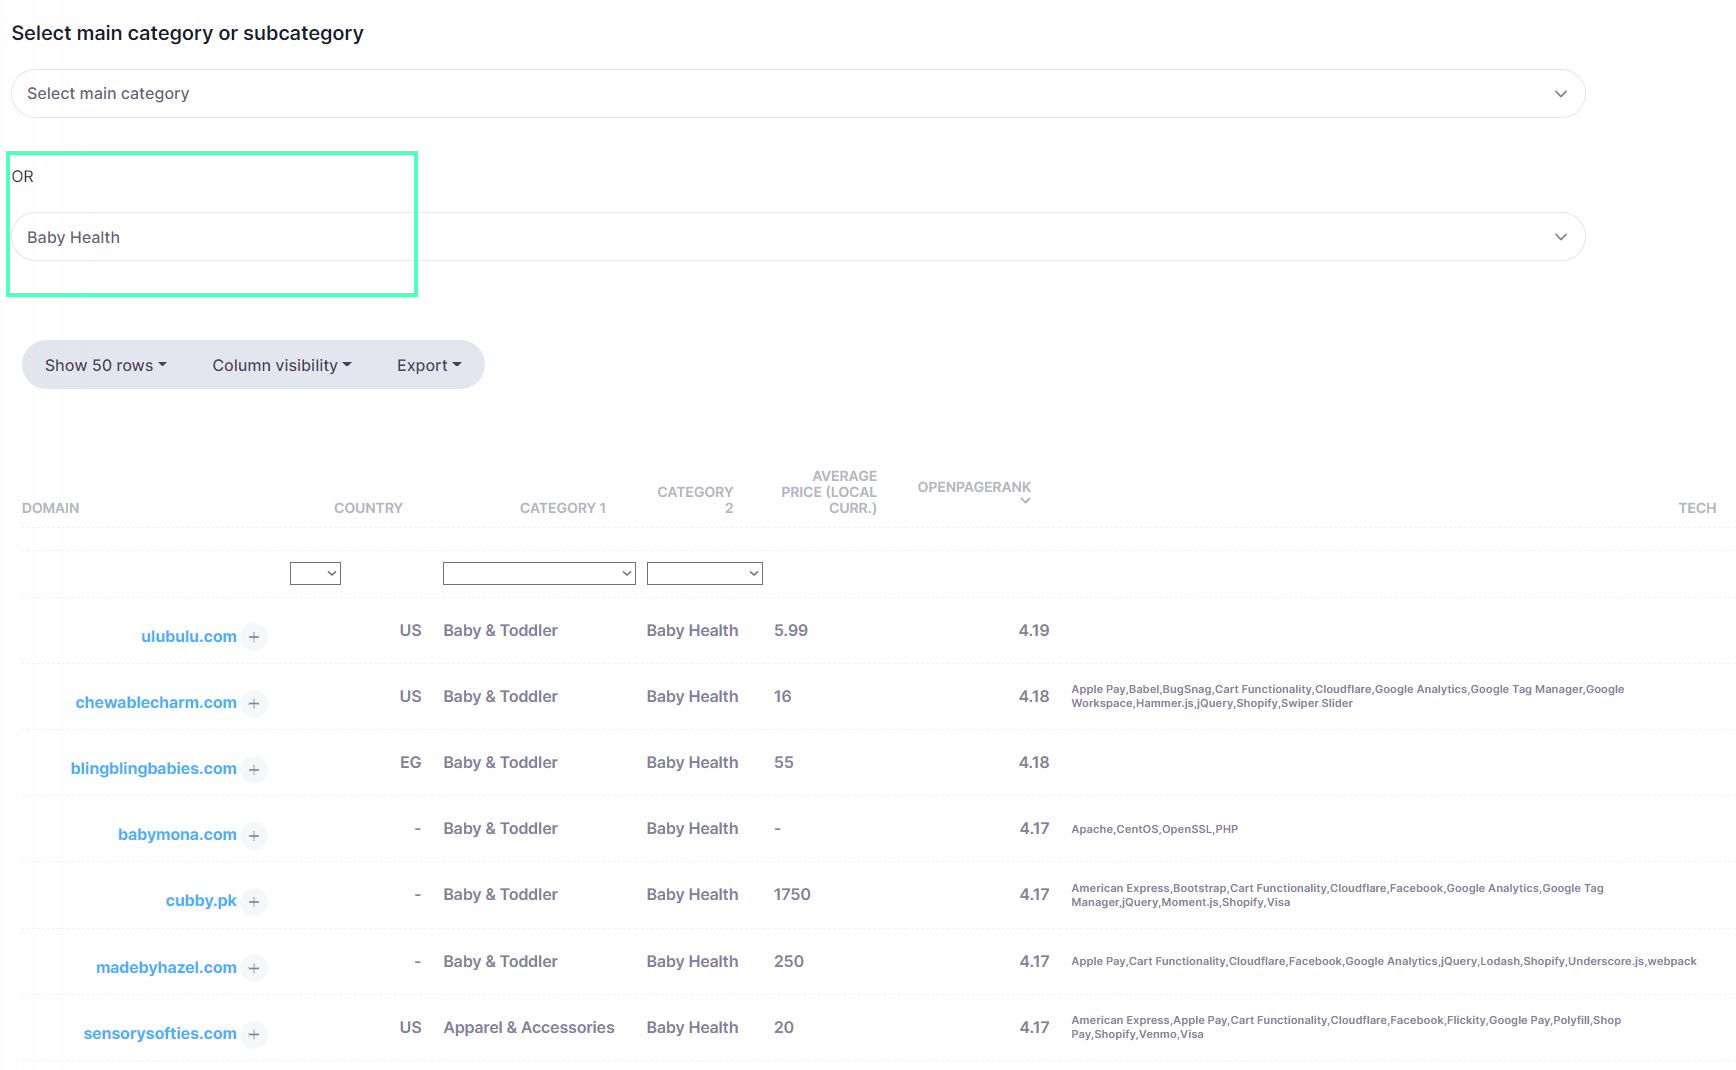
Choose a category

Pick a subcategory such as Baby Health. That one returns more than 250 stores.

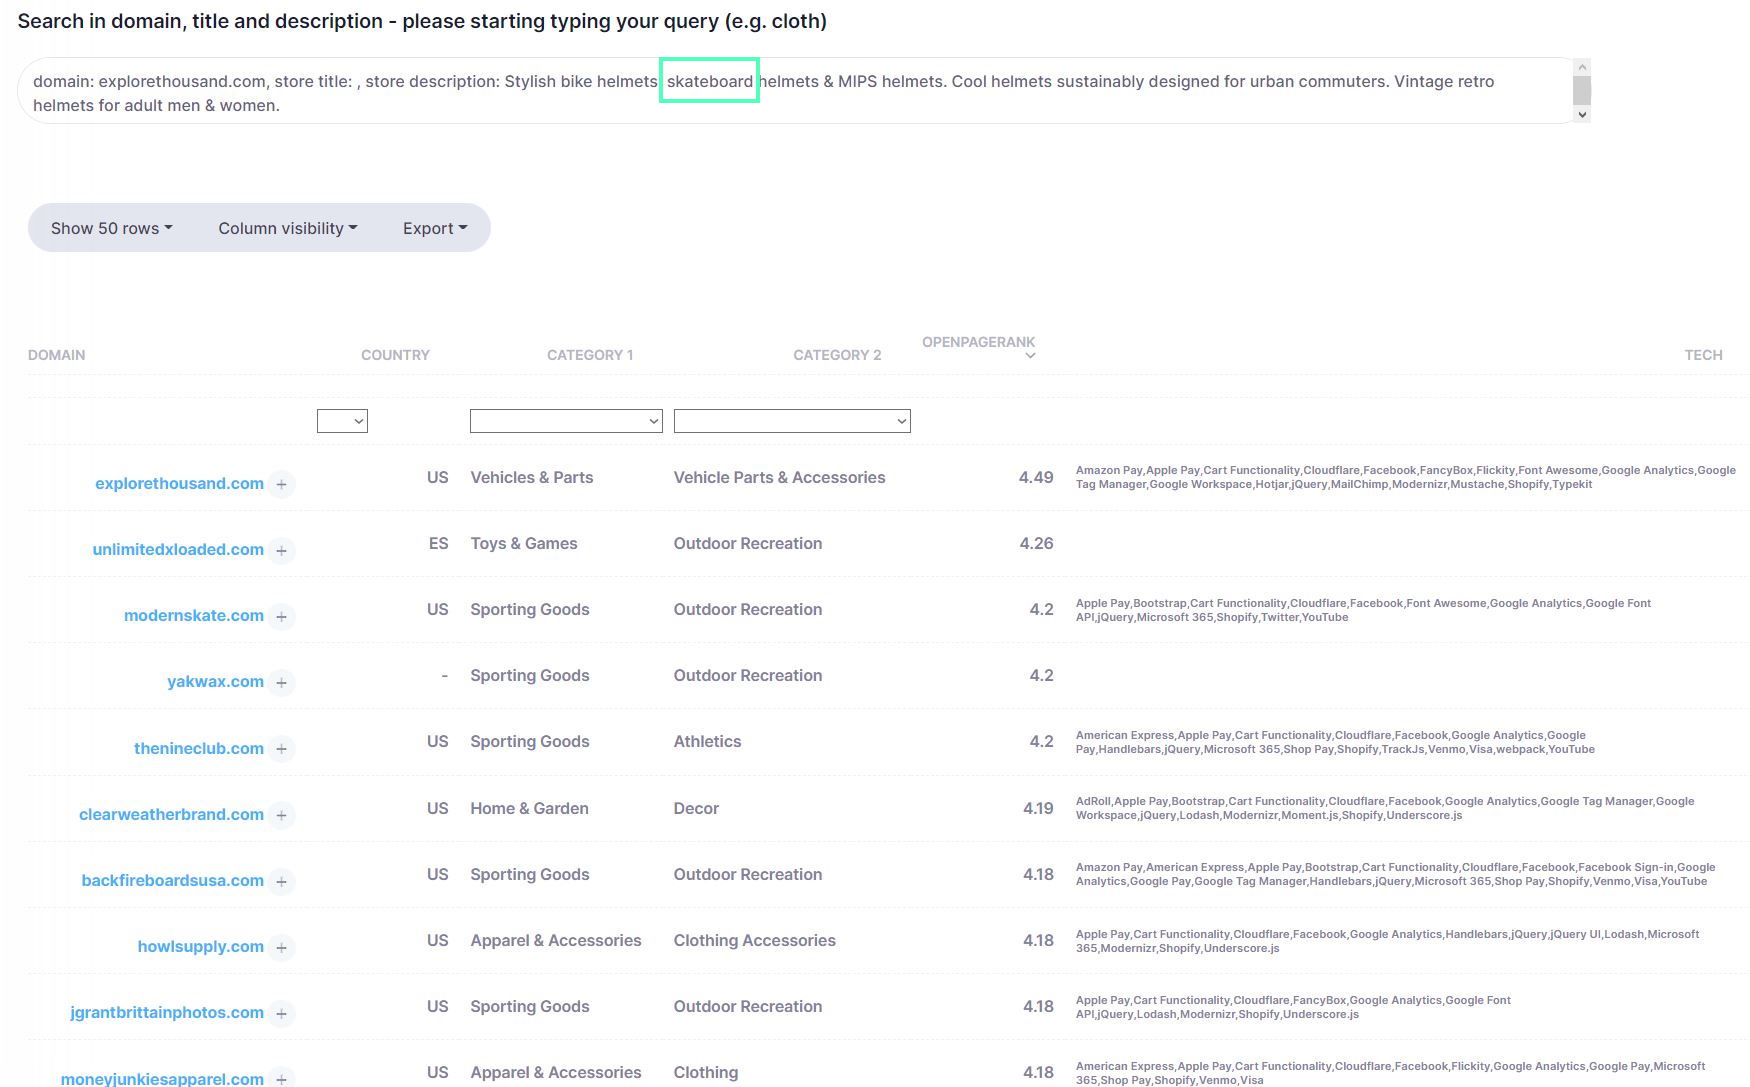
Or search a keyword

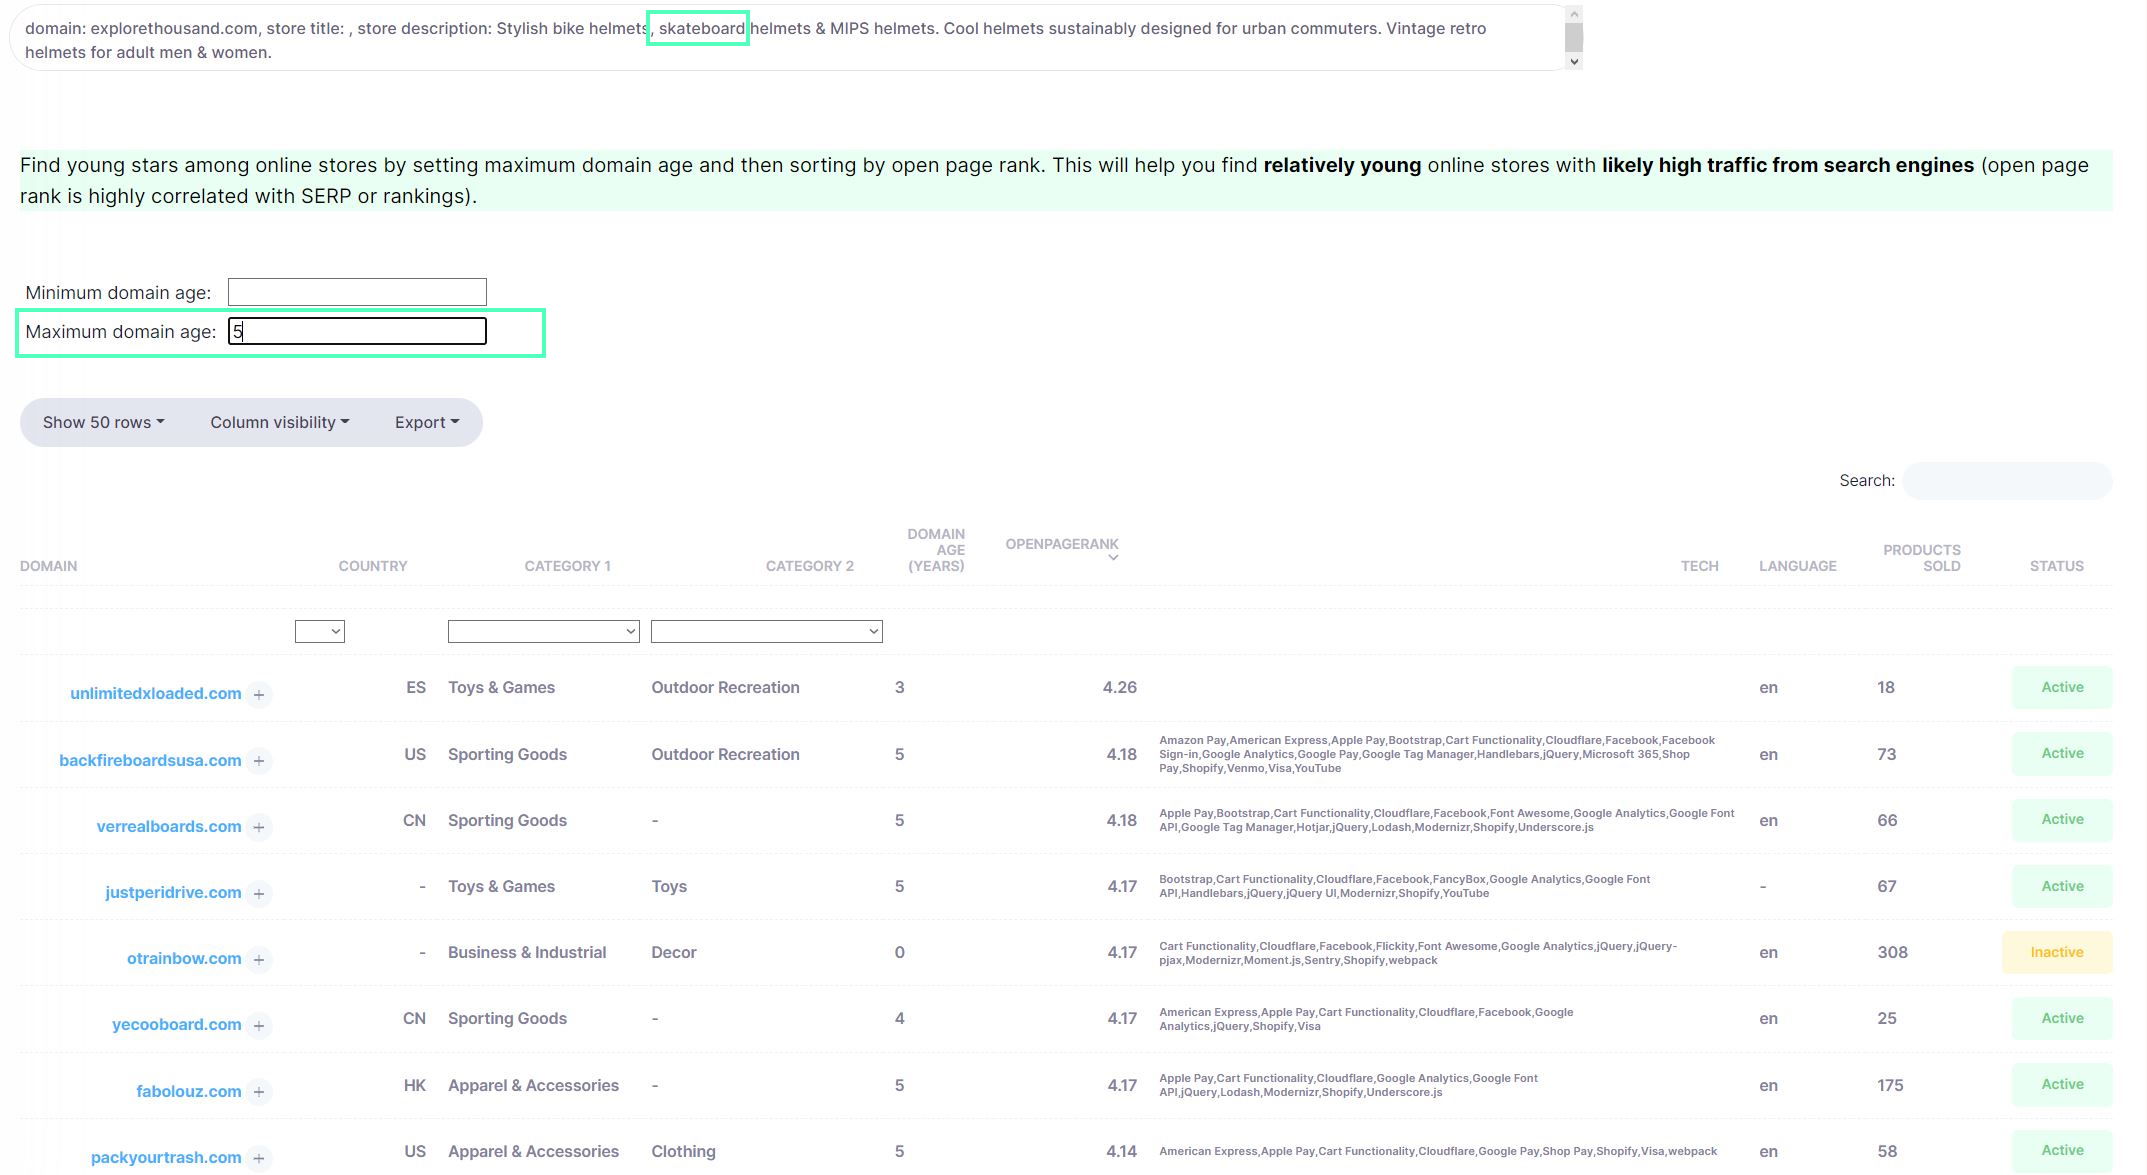
"Skateboard" returns around 900 stores selling skateboard products.

Filter for breakouts

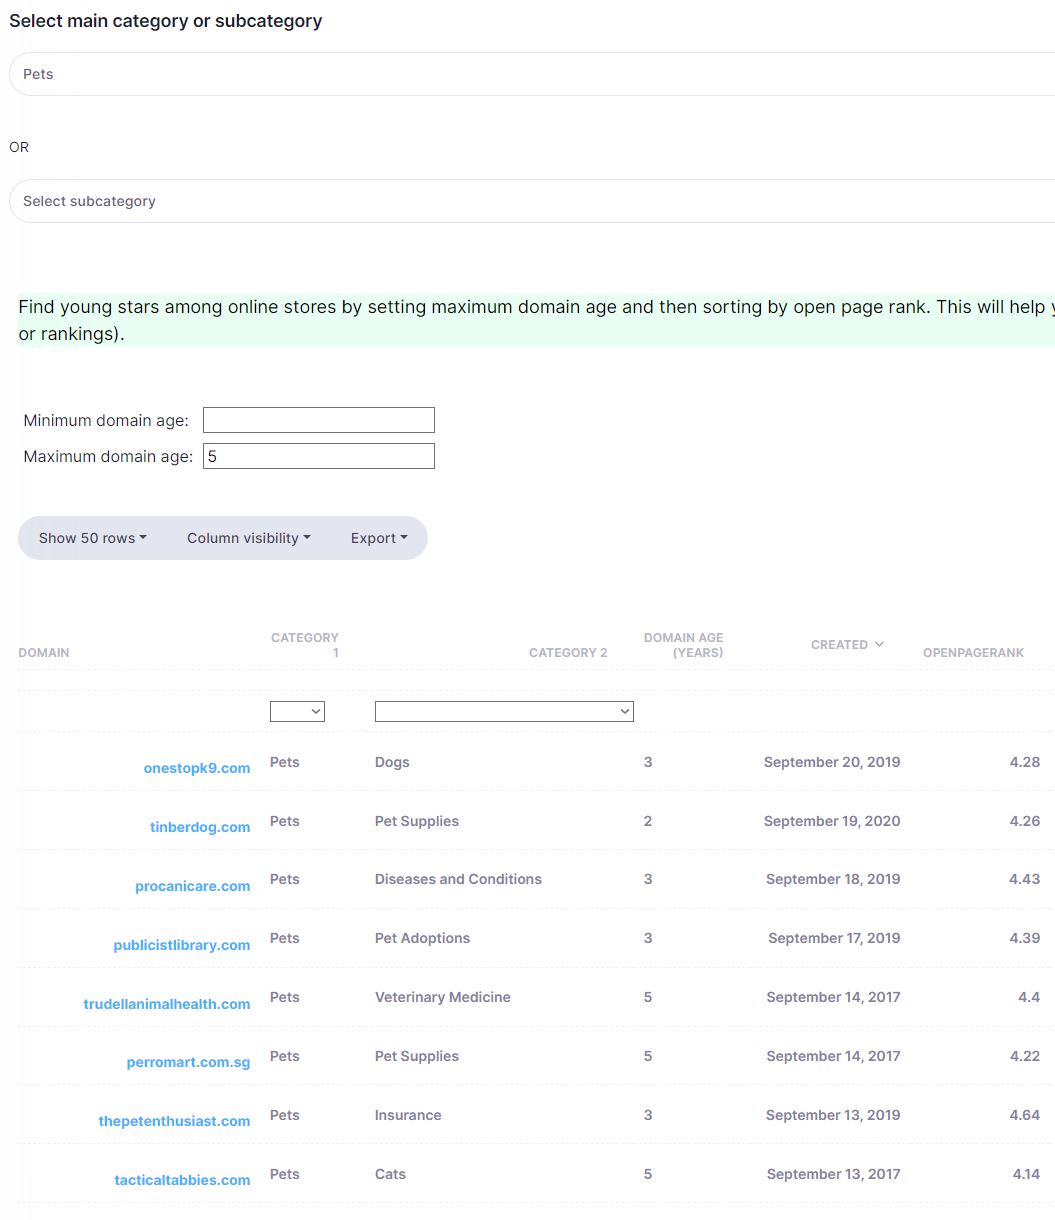
Set maximum domain age to 5 years and sort by authority.

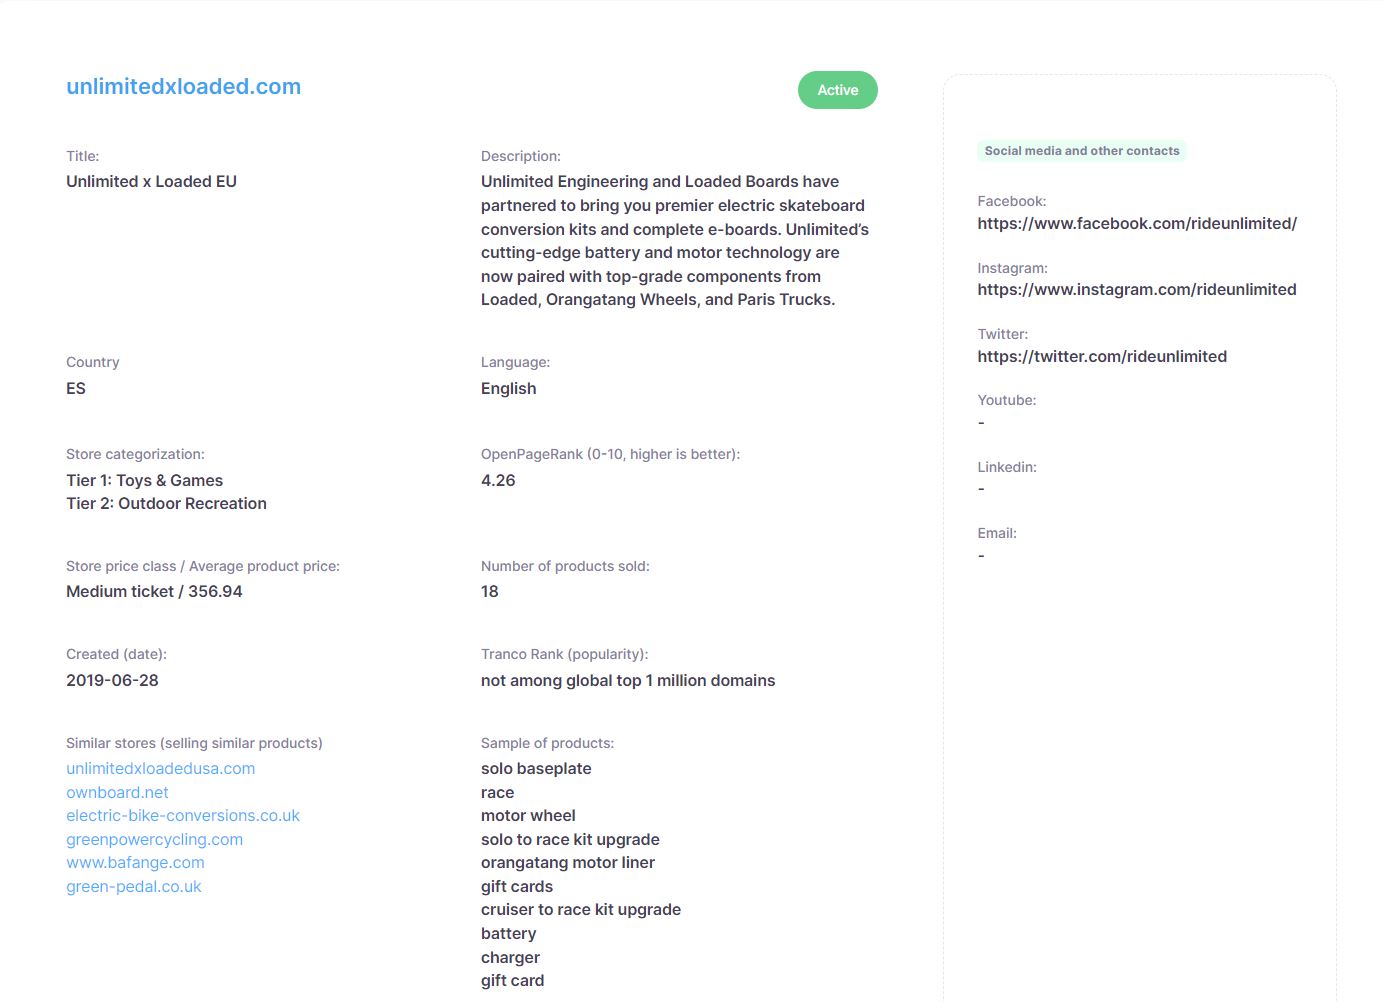
Open a row

Click the plus sign for the store's full profile and technologies.

Pattern we see again and again

Young domain + high authority = momentum

Stores that earn links faster than their age suggests usually sell something people talk about.

In the skateboard example, the top results all sold innovative electric boards.

Second angle

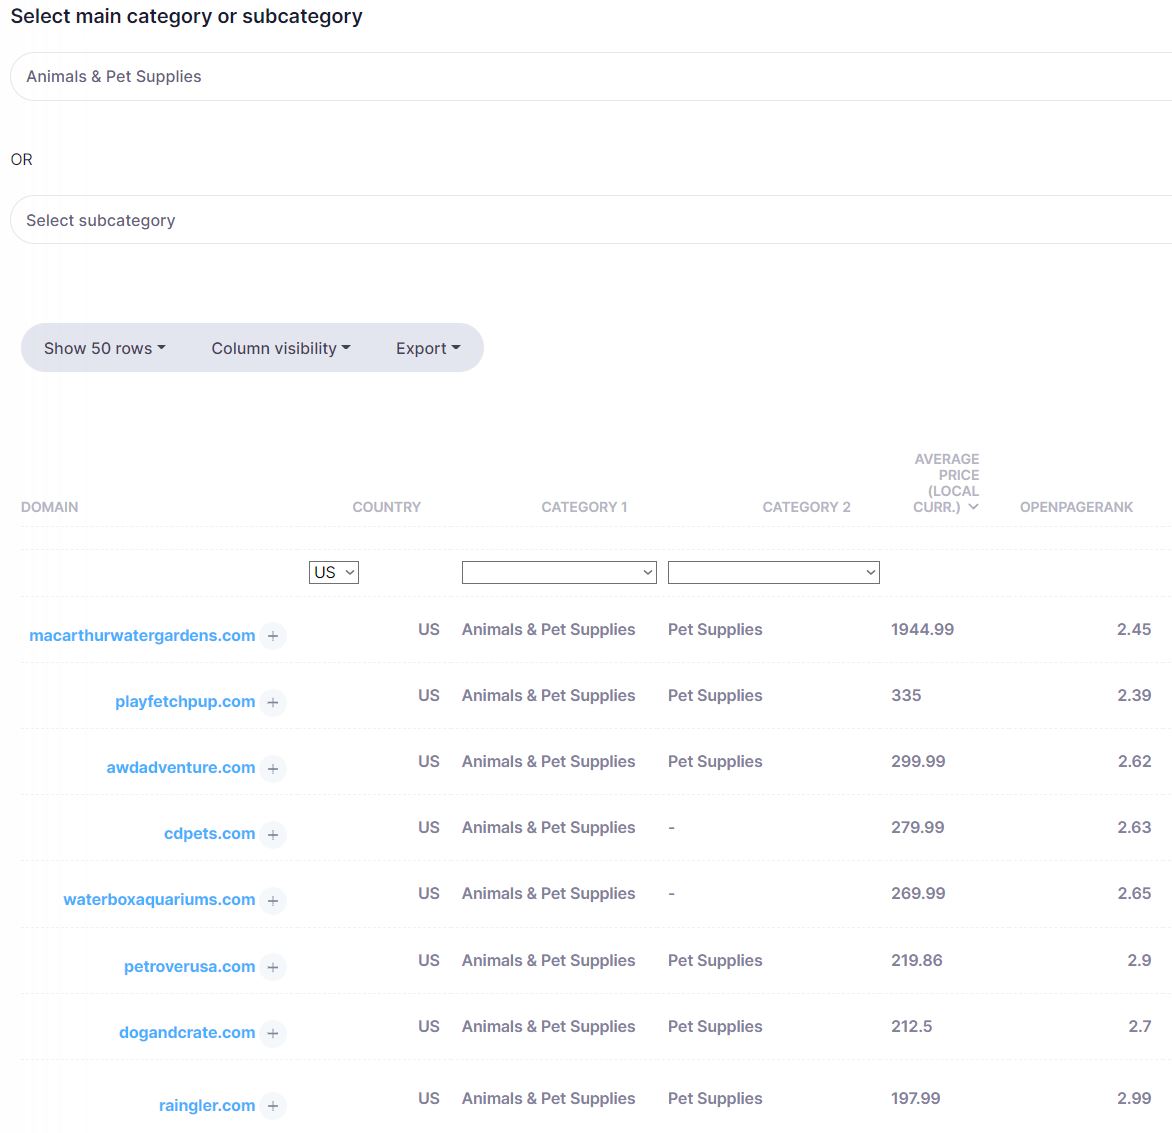
Sort by price to find premium players

Pick Pets and Animal Supplies, filter to the US, order by average price.

  • Designer crates and luxury dog beds
  • Pet furniture and modern rimless aquariums
  • Advanced pet strollers and car seats
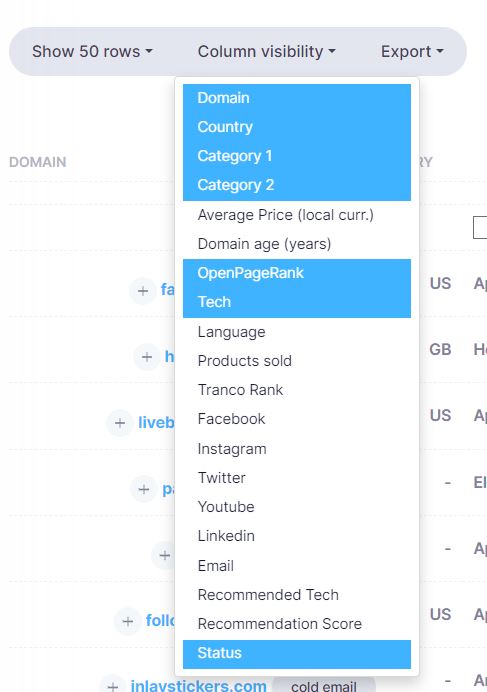
Store results for a selected subcategory
Stores in a selected subcategory
Store results for a keyword search
Keyword search across store names and descriptions
Young stores sorted by authority
Expanded store profile
Pet supply stores sorted by price
Pet supply stores in the US, sorted by price
Go deeper

See the Shopify store database and rising online stores pages.
02
Store owners

See which technologies would improve your business

The recommender learned from 4,000+ technologies across millions of websites. It tells you which tools stores like yours run that you do not.

Your store is in the database

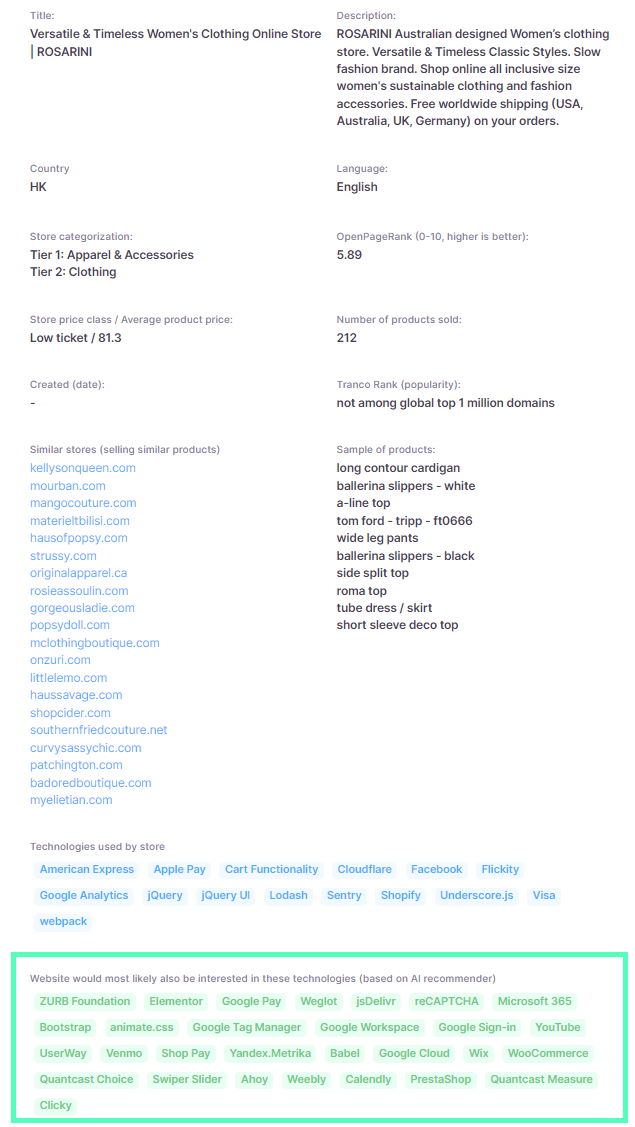
Search your domain. Recommendations show in a green box on its profile.

Your store is not listed yet

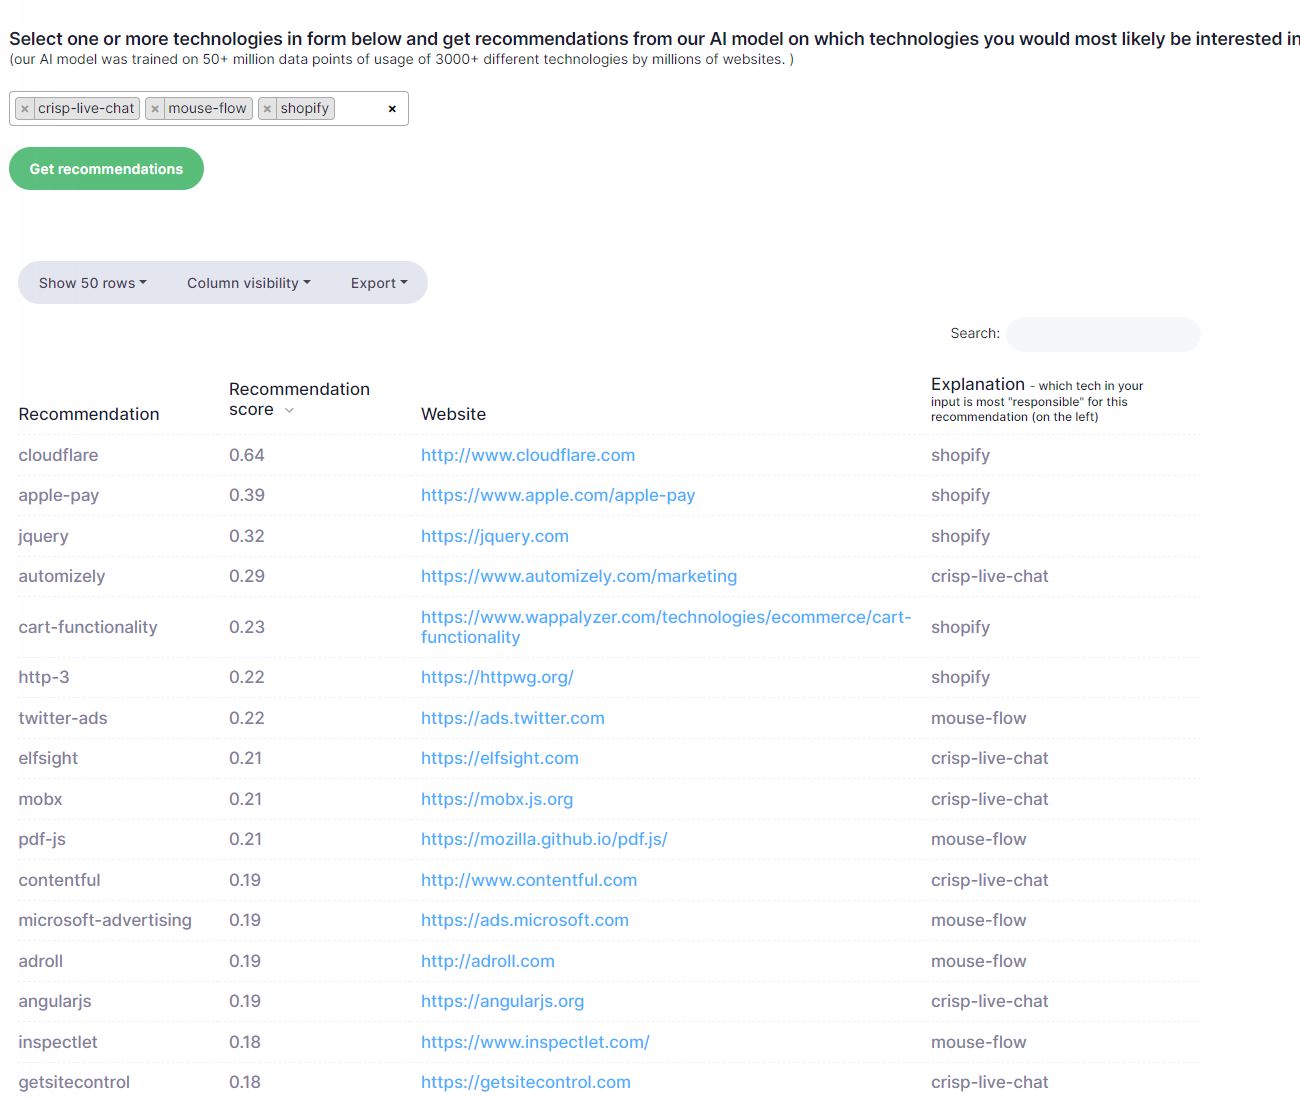
Type the tools you use, for example a session recorder, a live chat and your store platform. You get up to 1,000 recommendations.

You have a list of domains

Send up to 500 domains. We return recommendations for each one.

Every pick is explained

Each recommendation names the tool you already run that most drove it. You see why, not just what.

Technology recommendations for a domain
Recommendations on a store profile
Recommendations from a list of technologies
Recommendations from a typed list of tools
03
Store ownersBrands

Find high-ticket ecommerce products and ideas

Higher prices usually mean higher margins. Three routes lead to them.

Random draw

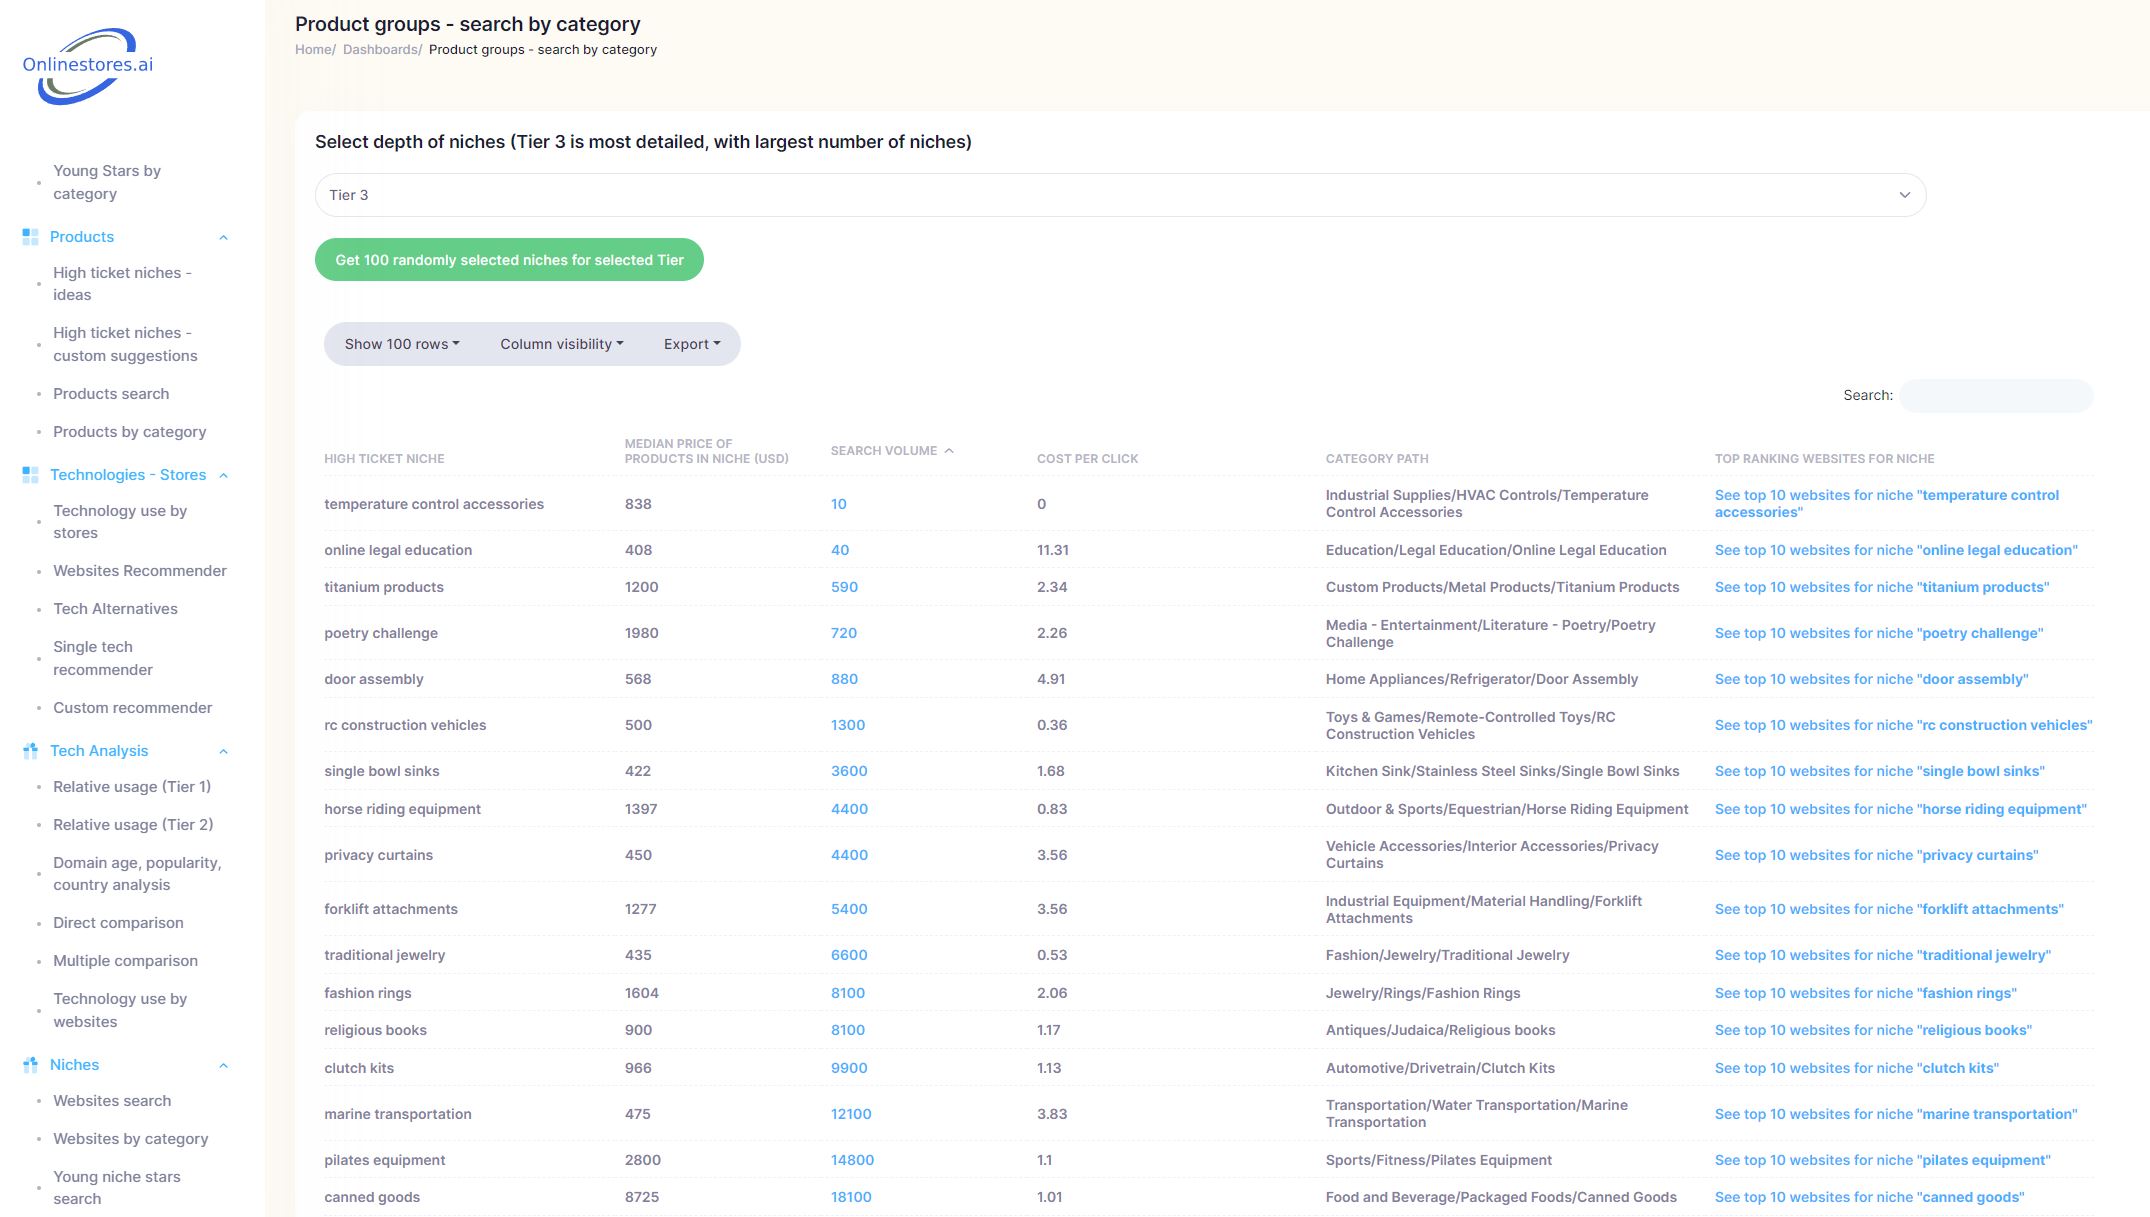
Pick a detail level and get 50 high-ticket niches per request from a pool of 40,000. We add 2,000 a month.

Adjacent niches

Enter your products or keywords. Get the high-ticket niches closest to what you already sell.

Product groups

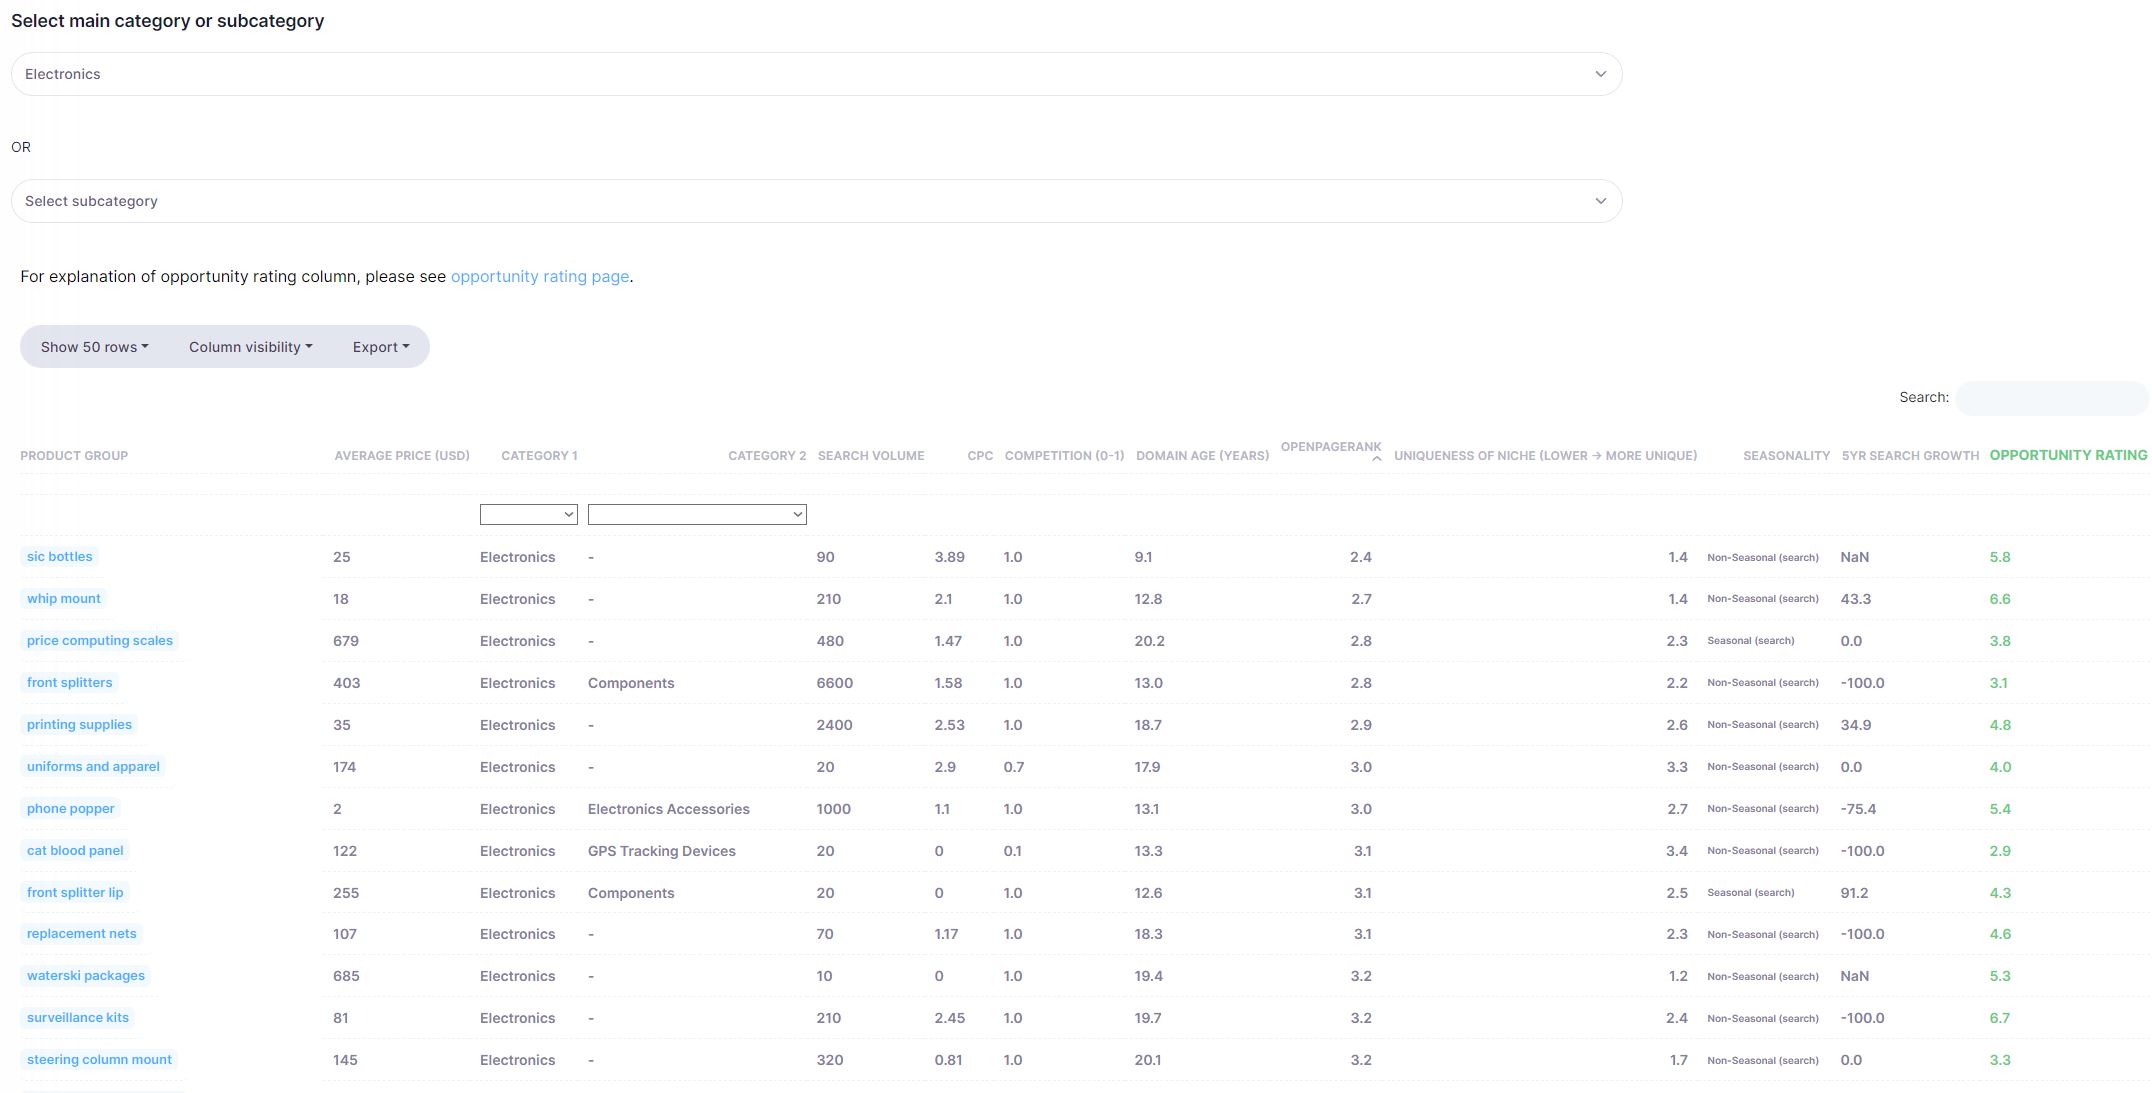
Browse 60,000+ groups built from 32 million products, each with price, demand and difficulty.

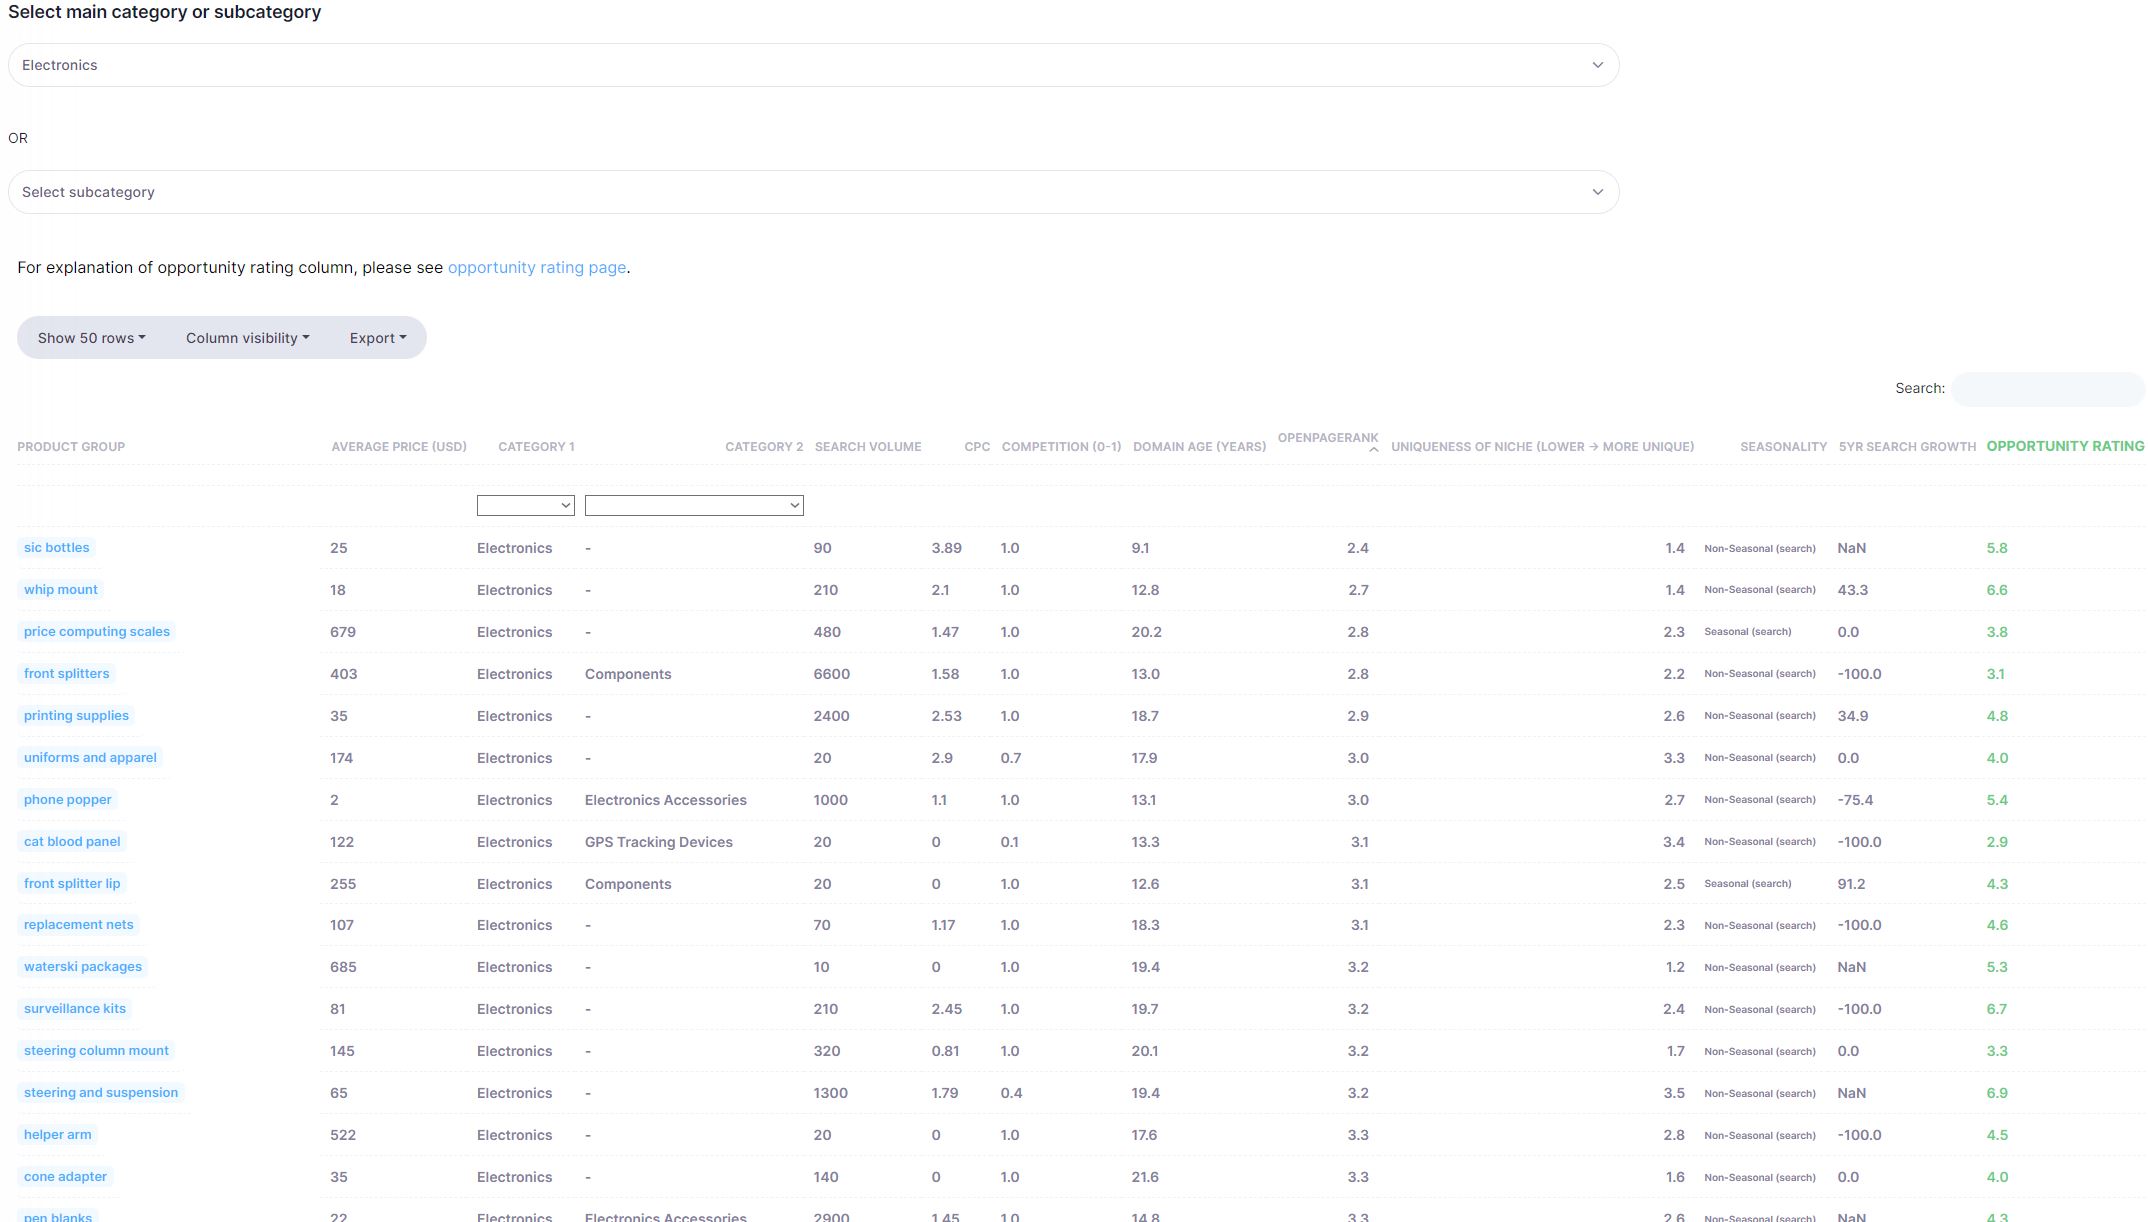
Electronics, sorted by price

Beyond the obvious pinball machines, laptops and smart TVs, the list surfaces niches few sellers have spotted.

LED dance floorsrestaurant paging systemsprice computing scalescellular signal boostersblindspot detectionstudio lighting controlsmodel airplane kits

Opportunity rating rewards

UpHigher price, higher demand, rising 5-year trend
UpYounger, weaker sites ranking for the product
UpUnique, non-seasonal, low ad cost, low competition
Sort any category by one combined score
High ticket niches
High-ticket niches drawn per request
Product groups in Electronics
Product groups in Electronics with metrics
04
SaaS vendorsAgencies

Get the websites most likely to want your product

The recommender works like a retail "customers also bought" engine. It recommends technologies to websites, based on what they already run.

Competitor users

  • You must convince them to switch
  • Their current tool already works
  • Still available on the platform, see workflow 5

Recommender picks

  • No incumbent in your slot
  • Offer your tool as an addition to their stack
  • Thousands of sites per technology, depending on plan
Pool 1

1M+ online stores

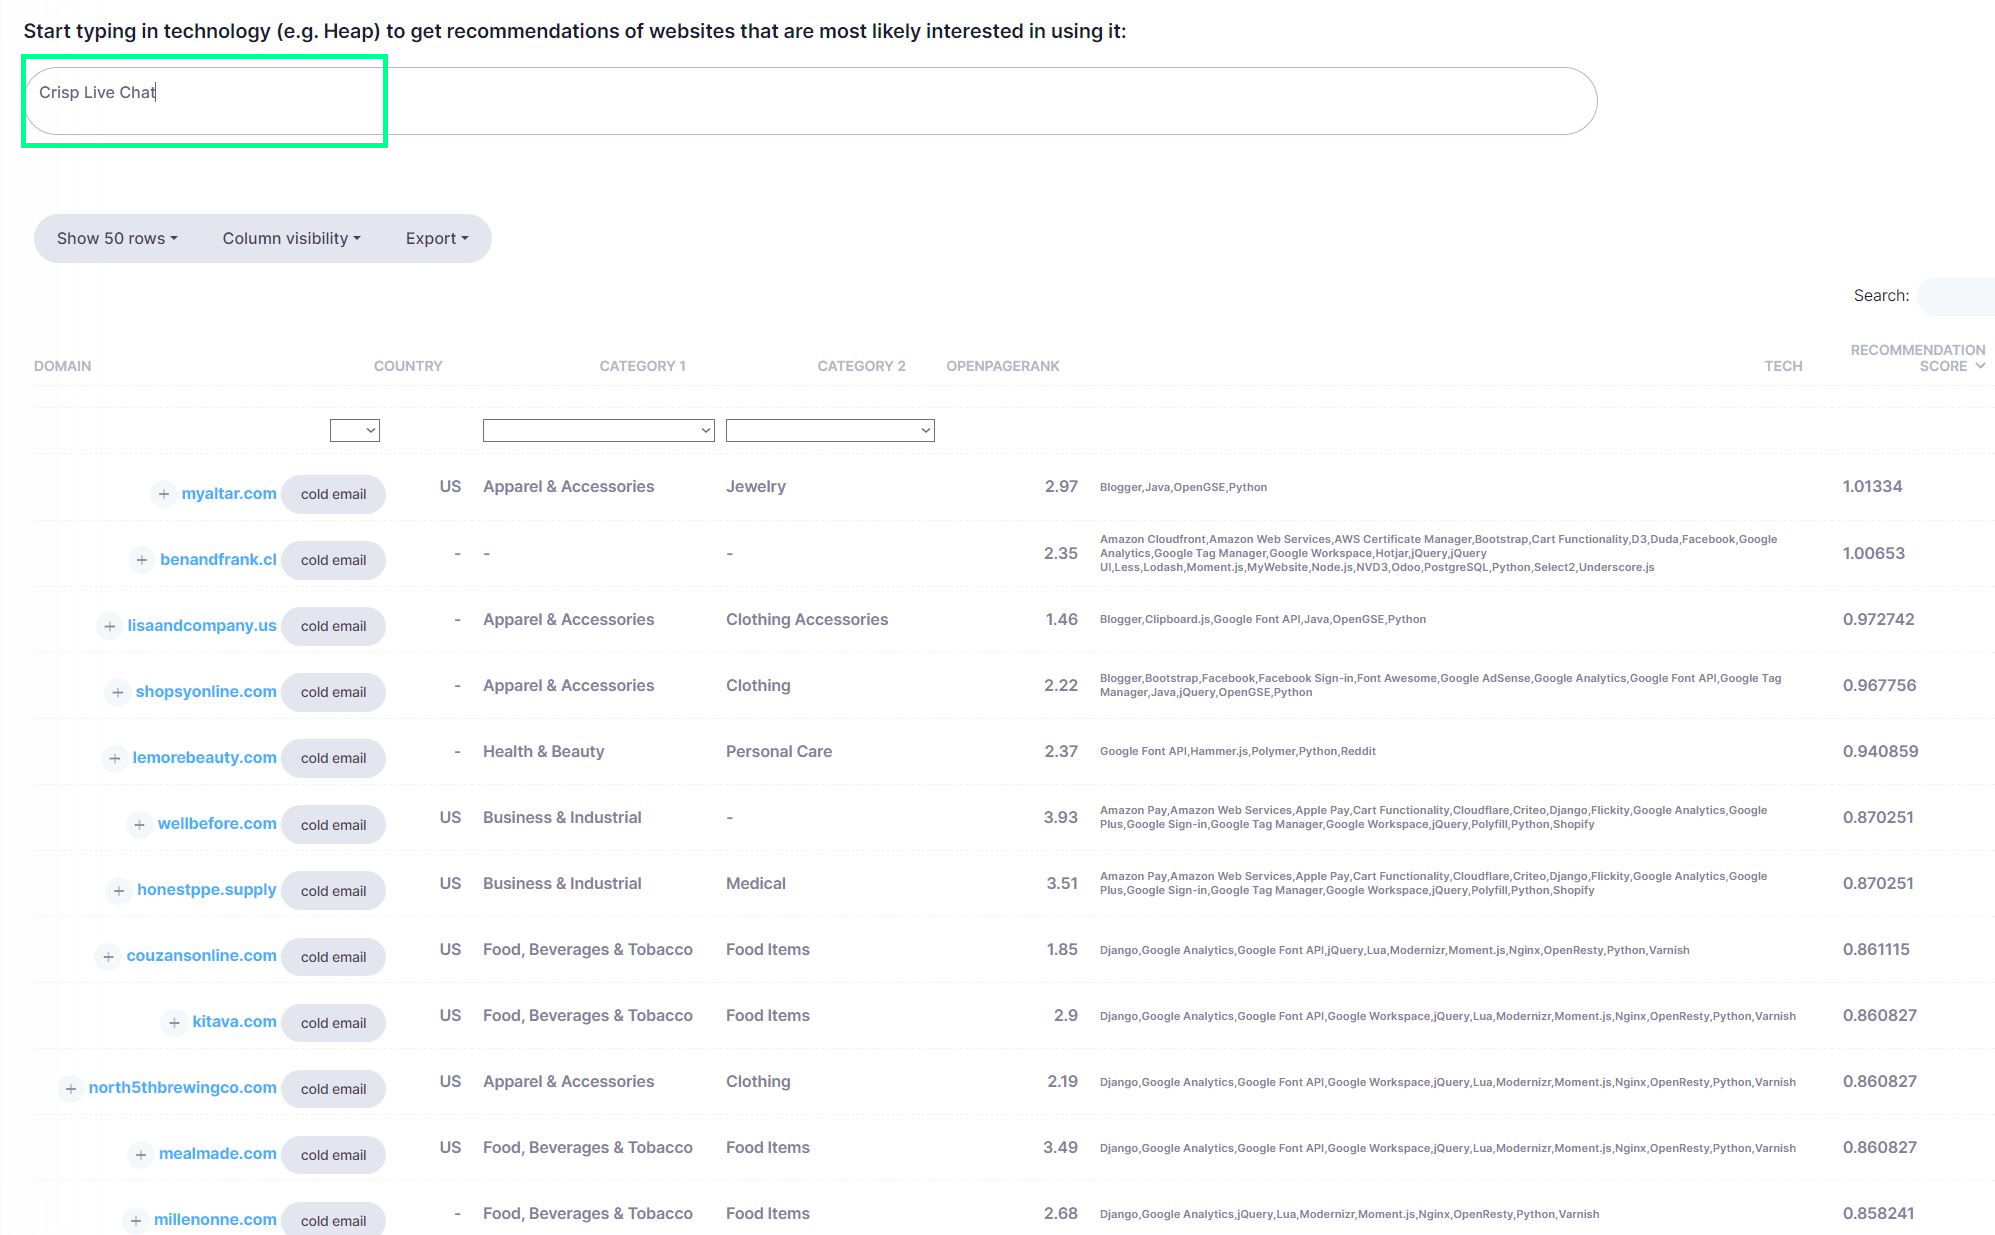
Type a technology, for example a live chat tool. Get stores most likely to adopt it.

Pool 2

5M popular domains

The same recommendations for non-ecommerce sites worldwide.

Pool 3

Above-average verticals

Sites in categories where your technology over-indexes but which do not use it yet.

Category over-index, in one example

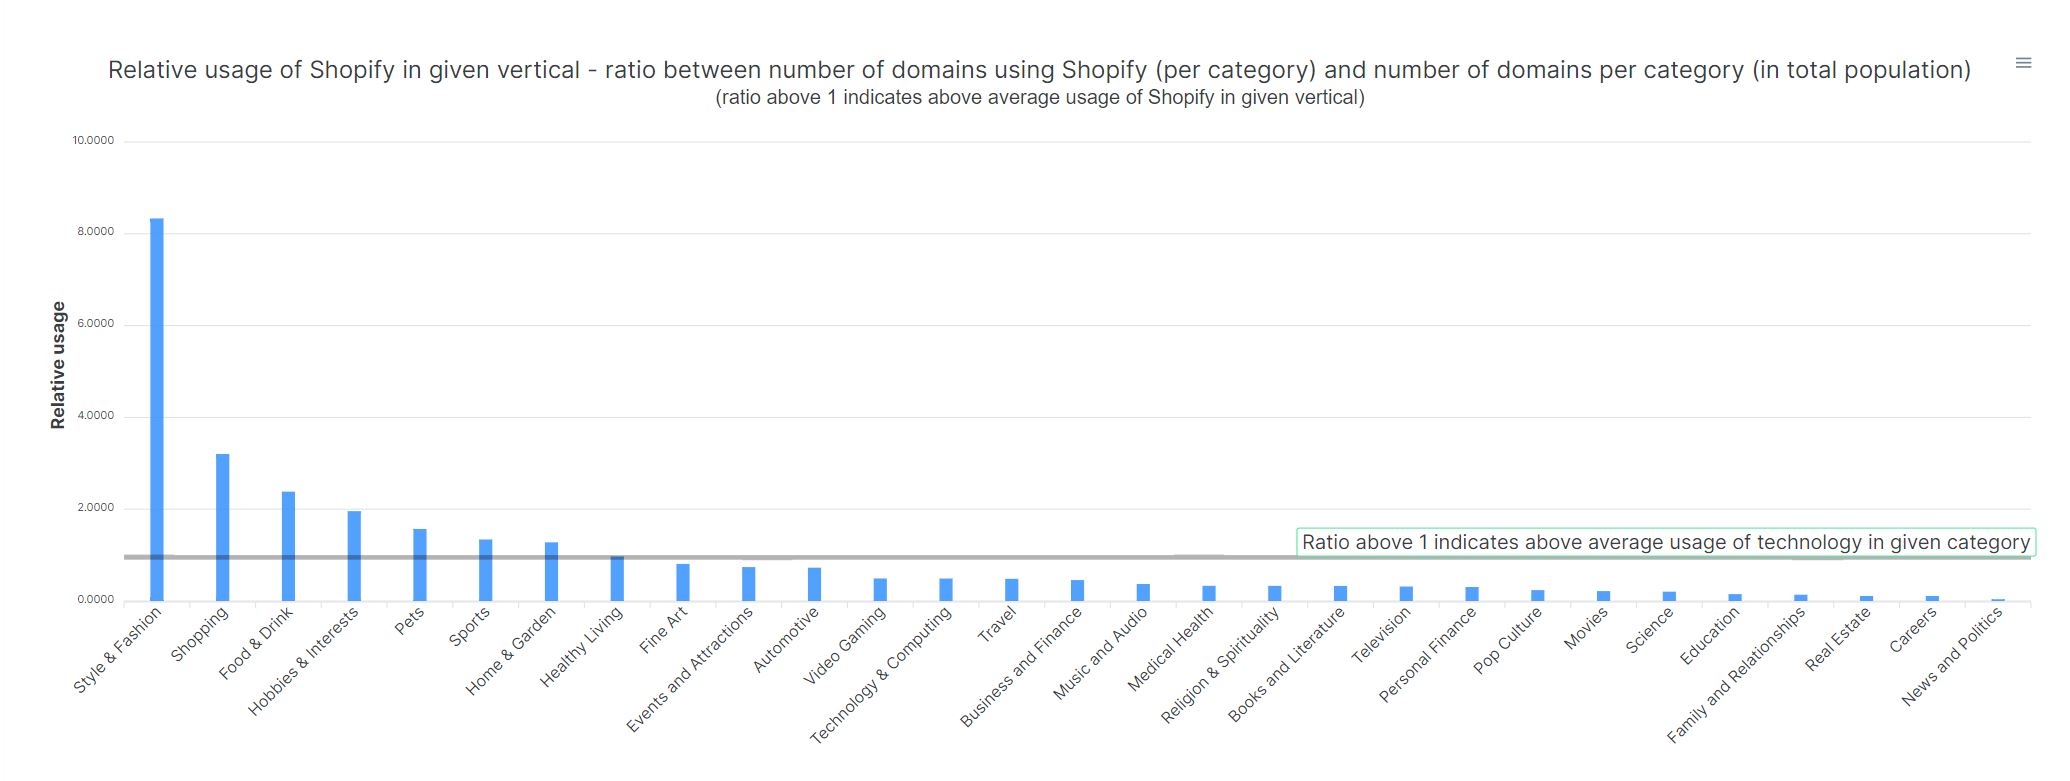
Shopify is used 8.1 times more in Style & Fashion than that category's share of all domains would predict.

Shopping, Food & Drink, Hobbies & Interests, Pets, Sports and Home & Garden also sit above 1.0.

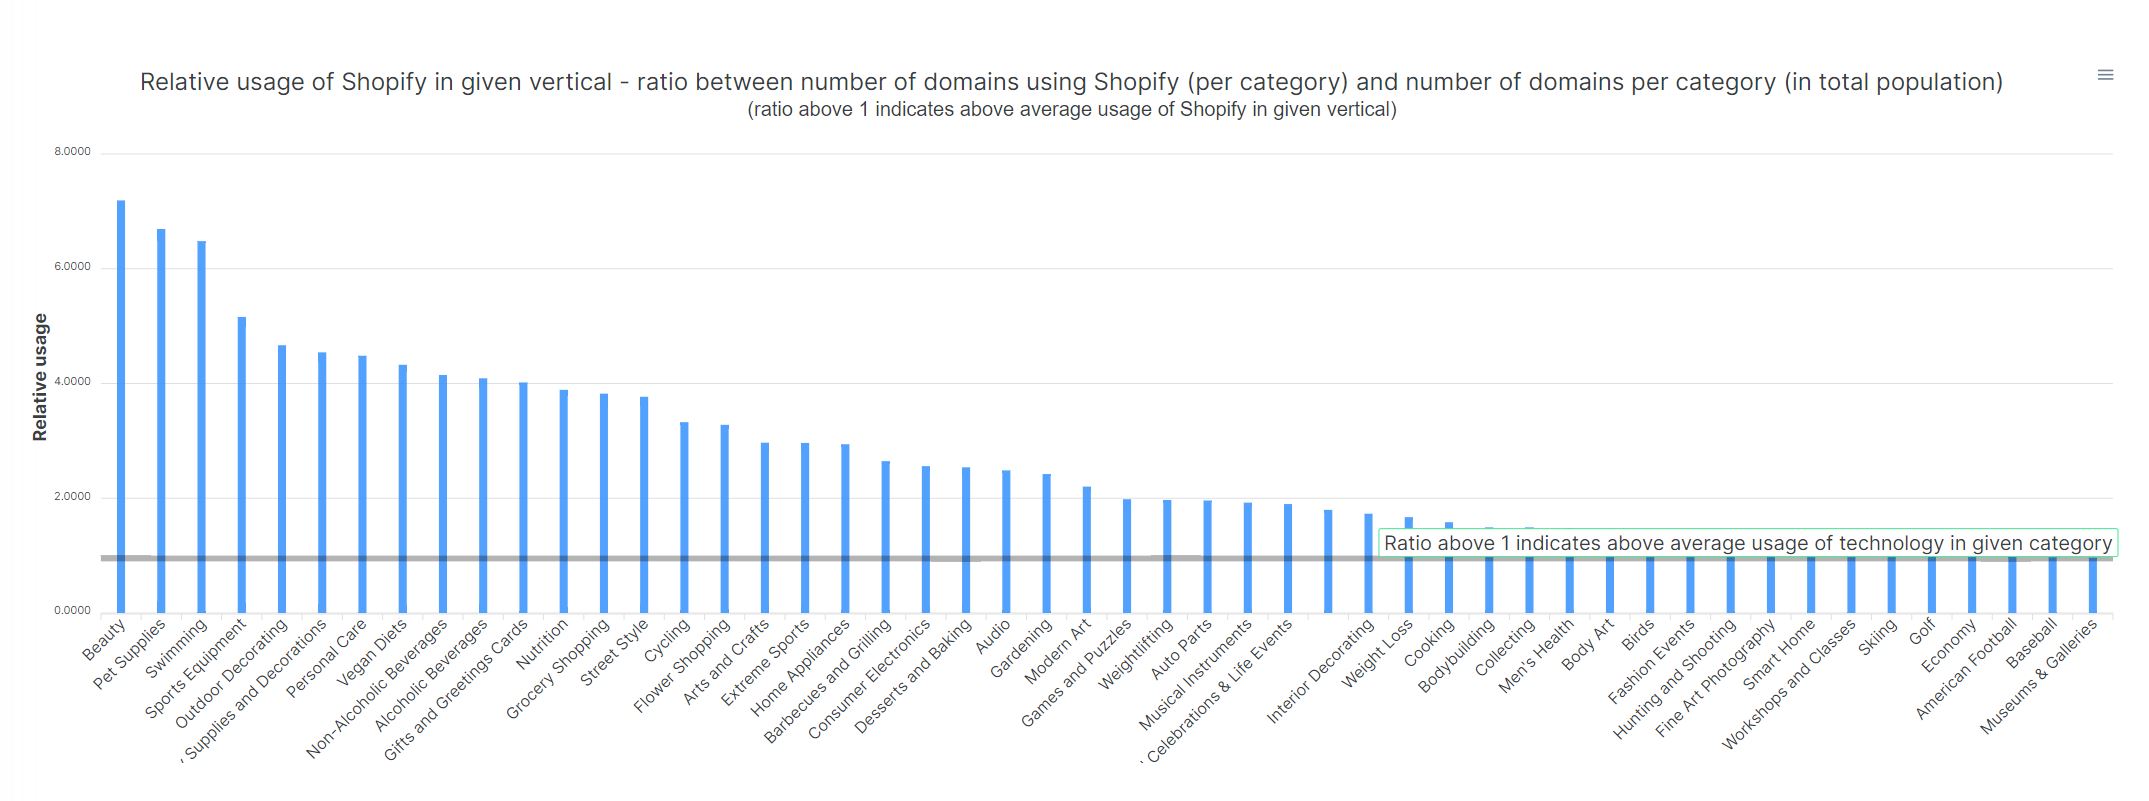
Tier 2 categories above average for Shopify

BeautyPet SuppliesSwimmingSports EquipmentOutdoor DecoratingParty SuppliesPersonal CareVegan DietsNon-Alcoholic BeveragesAlcoholic BeveragesGifts and Greetings CardsNutritionGrocery ShoppingCyclingFlower ShoppingArts and CraftsExtreme SportsHome Appliances
Websites likely interested in a technology
Sites most likely to adopt a chosen technology
Shopify relative usage across Tier 1 categories
Relative usage across Tier 1 categories
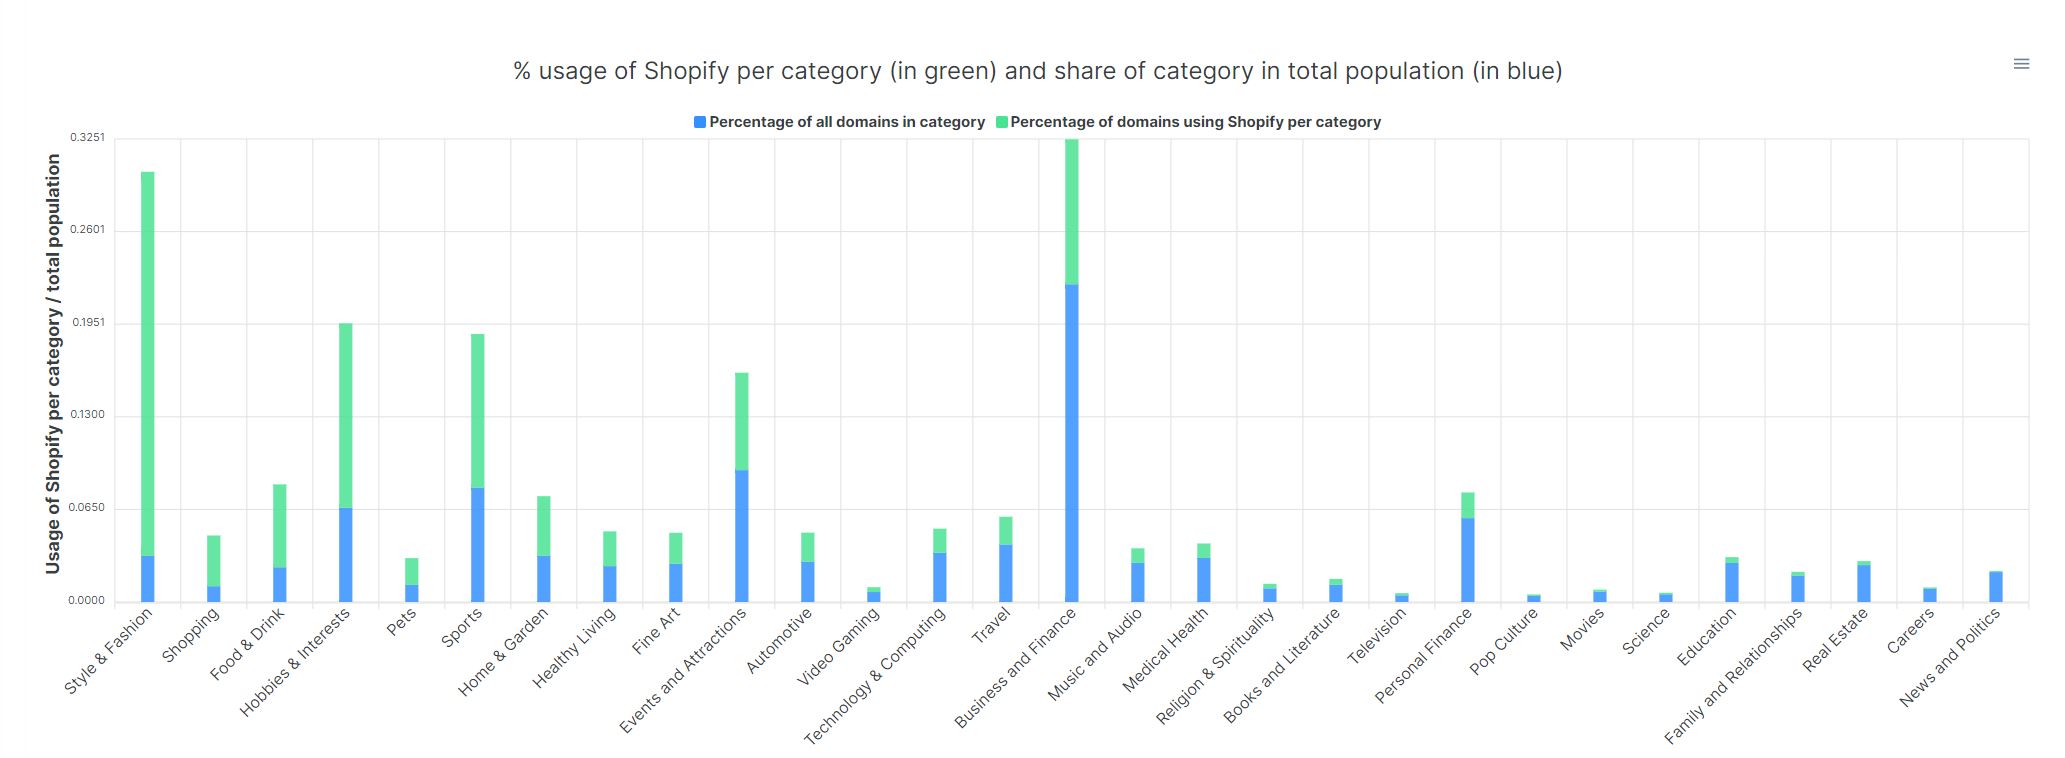
Usage with baseline category shares
Usage against baseline category shares
Tier 2 relative usage
Tier 2 relative usage, top 50 shown
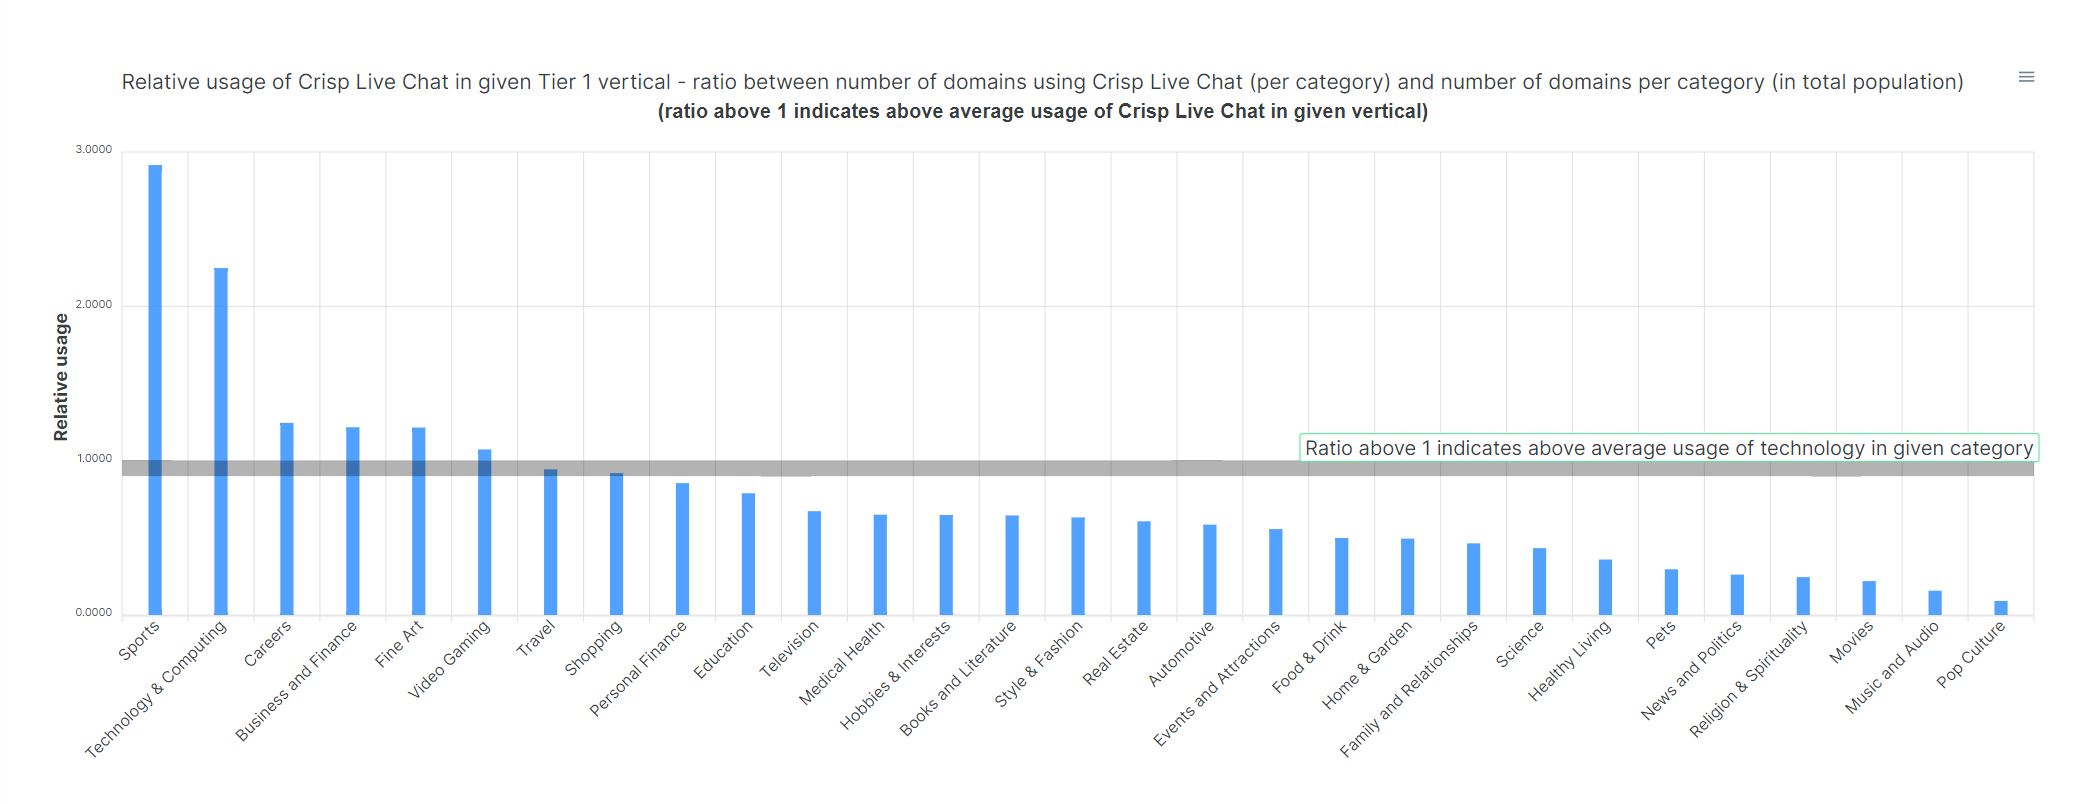
Live chat relative usage
A live chat tool across Tier 1 categories
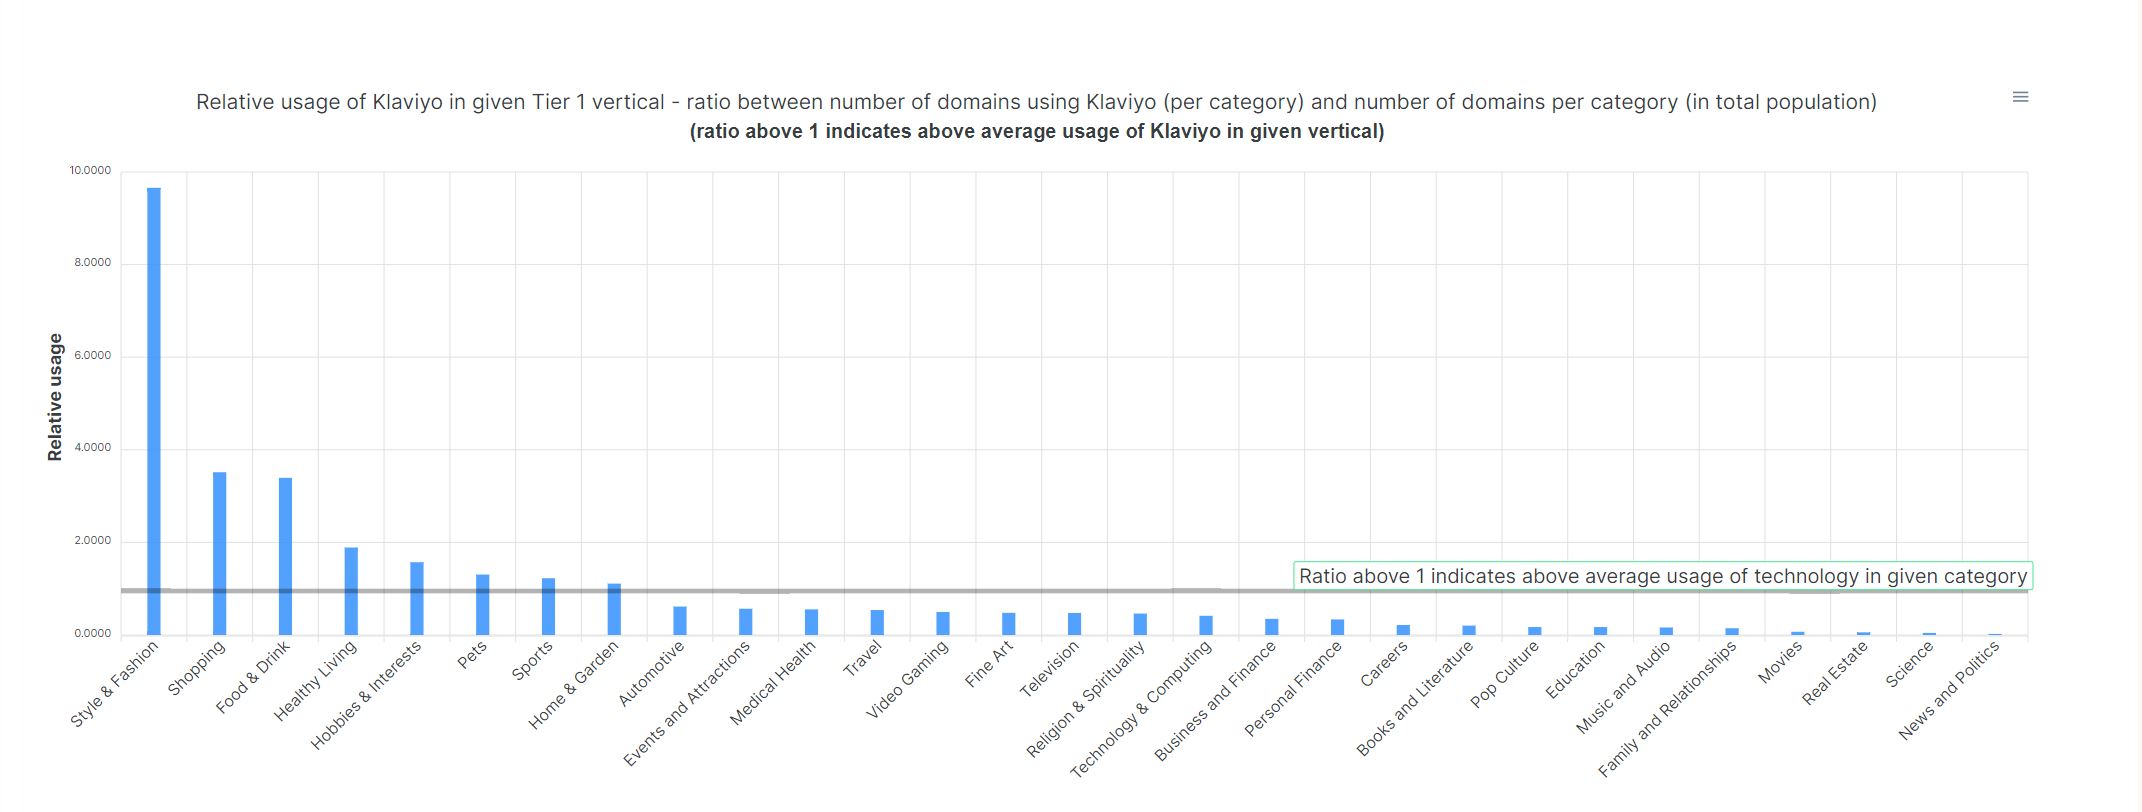
Email marketing tool relative usage
An email marketing tool across Tier 1 categories
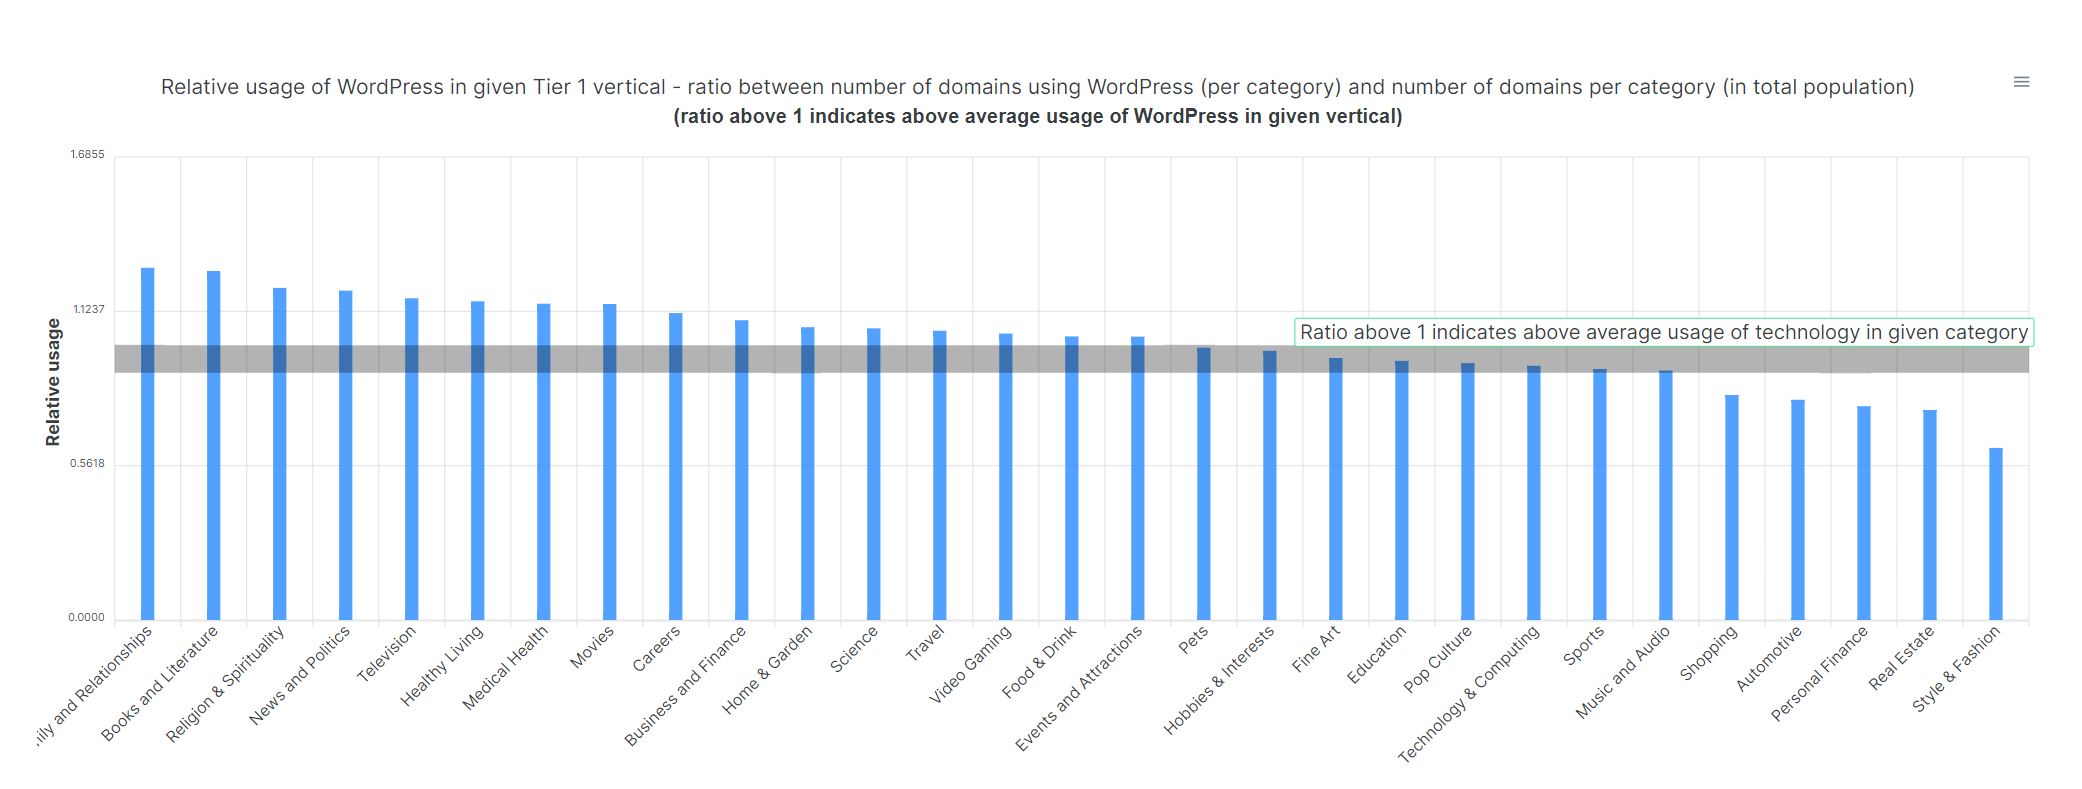
WordPress relative usage
WordPress: one of the most evenly spread technologies
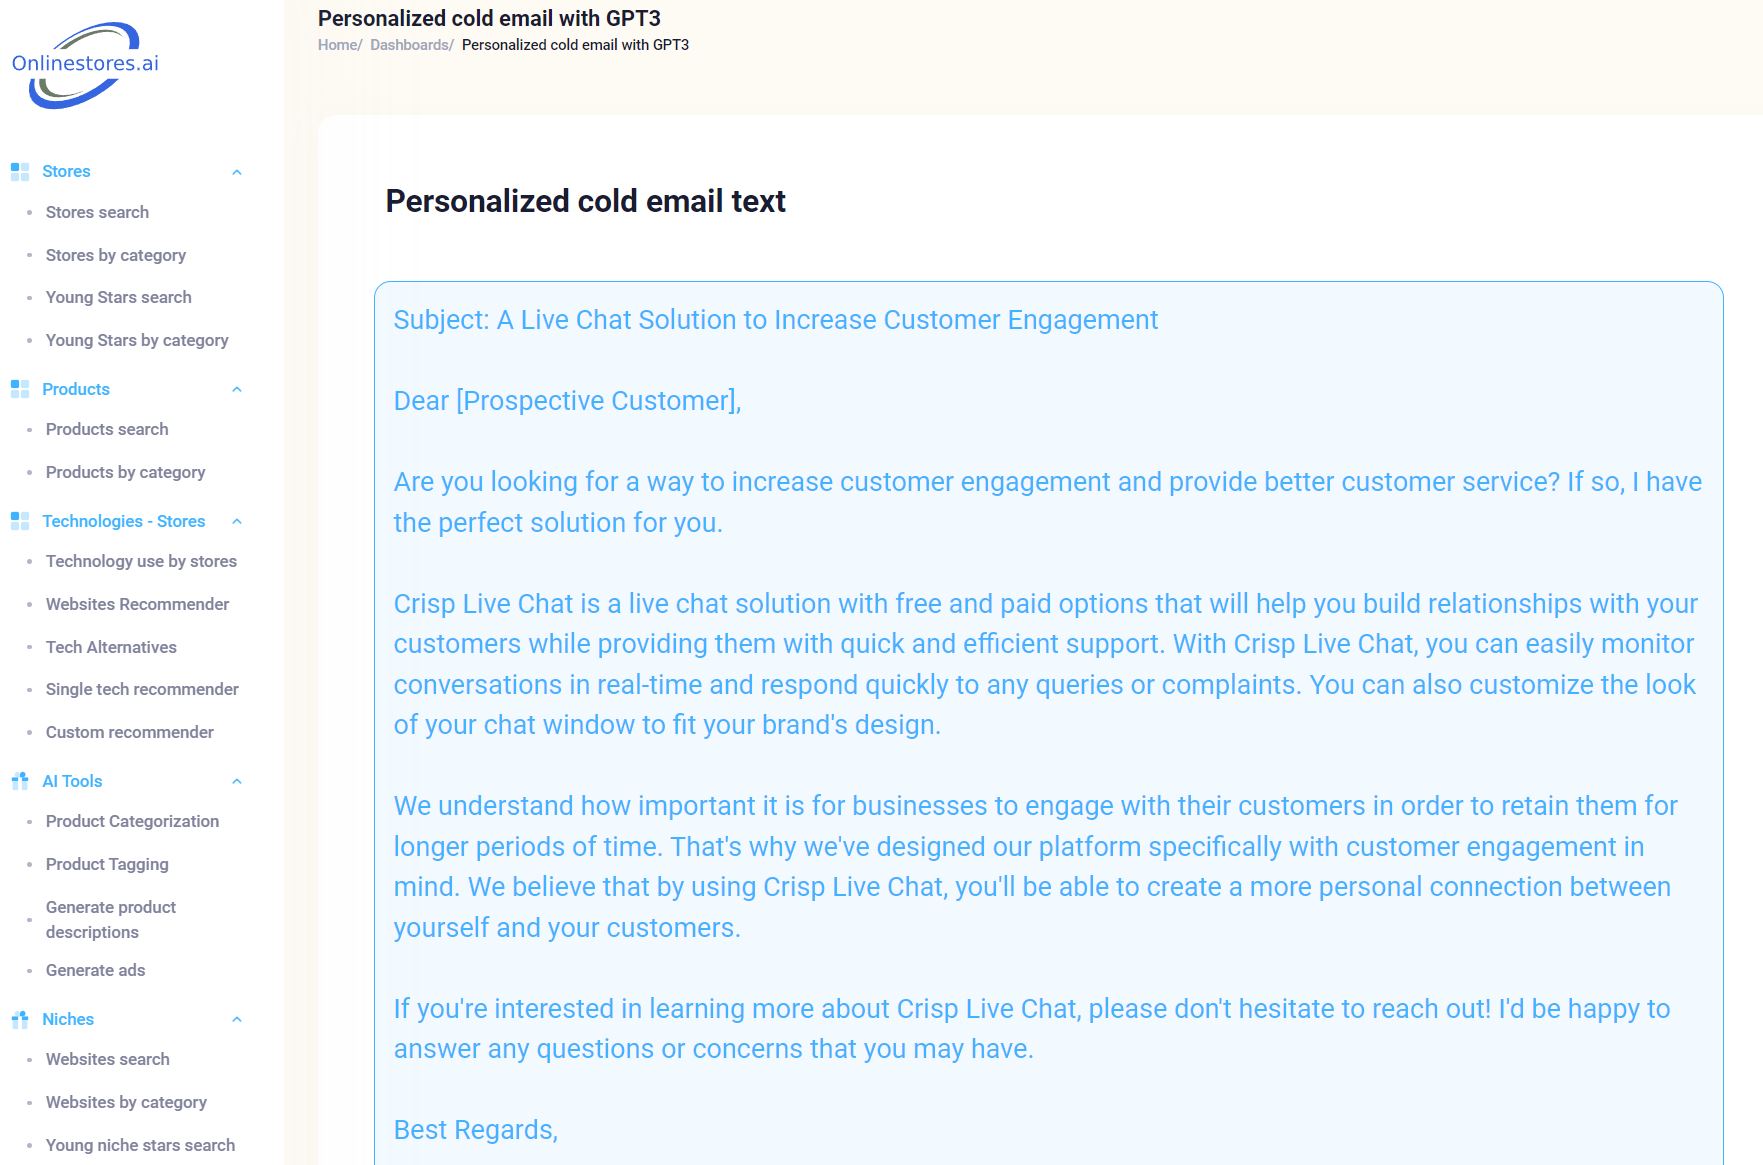
Cold email button next to a lead
One-click AI cold email next to each lead
Go deeper

See the AI lead recommender and AI cold email pages.

05
SalesAgencies

Find stores and websites using a specific technology

Type any of 4,000+ technologies. Get the stores that run it, each with 20+ metrics.

Filter

Where

Country and language.

Filter

What

Vertical and category.

Filter

How big

Average price and number of products.

Filter

How strong

Domain age, authority and popularity rank.

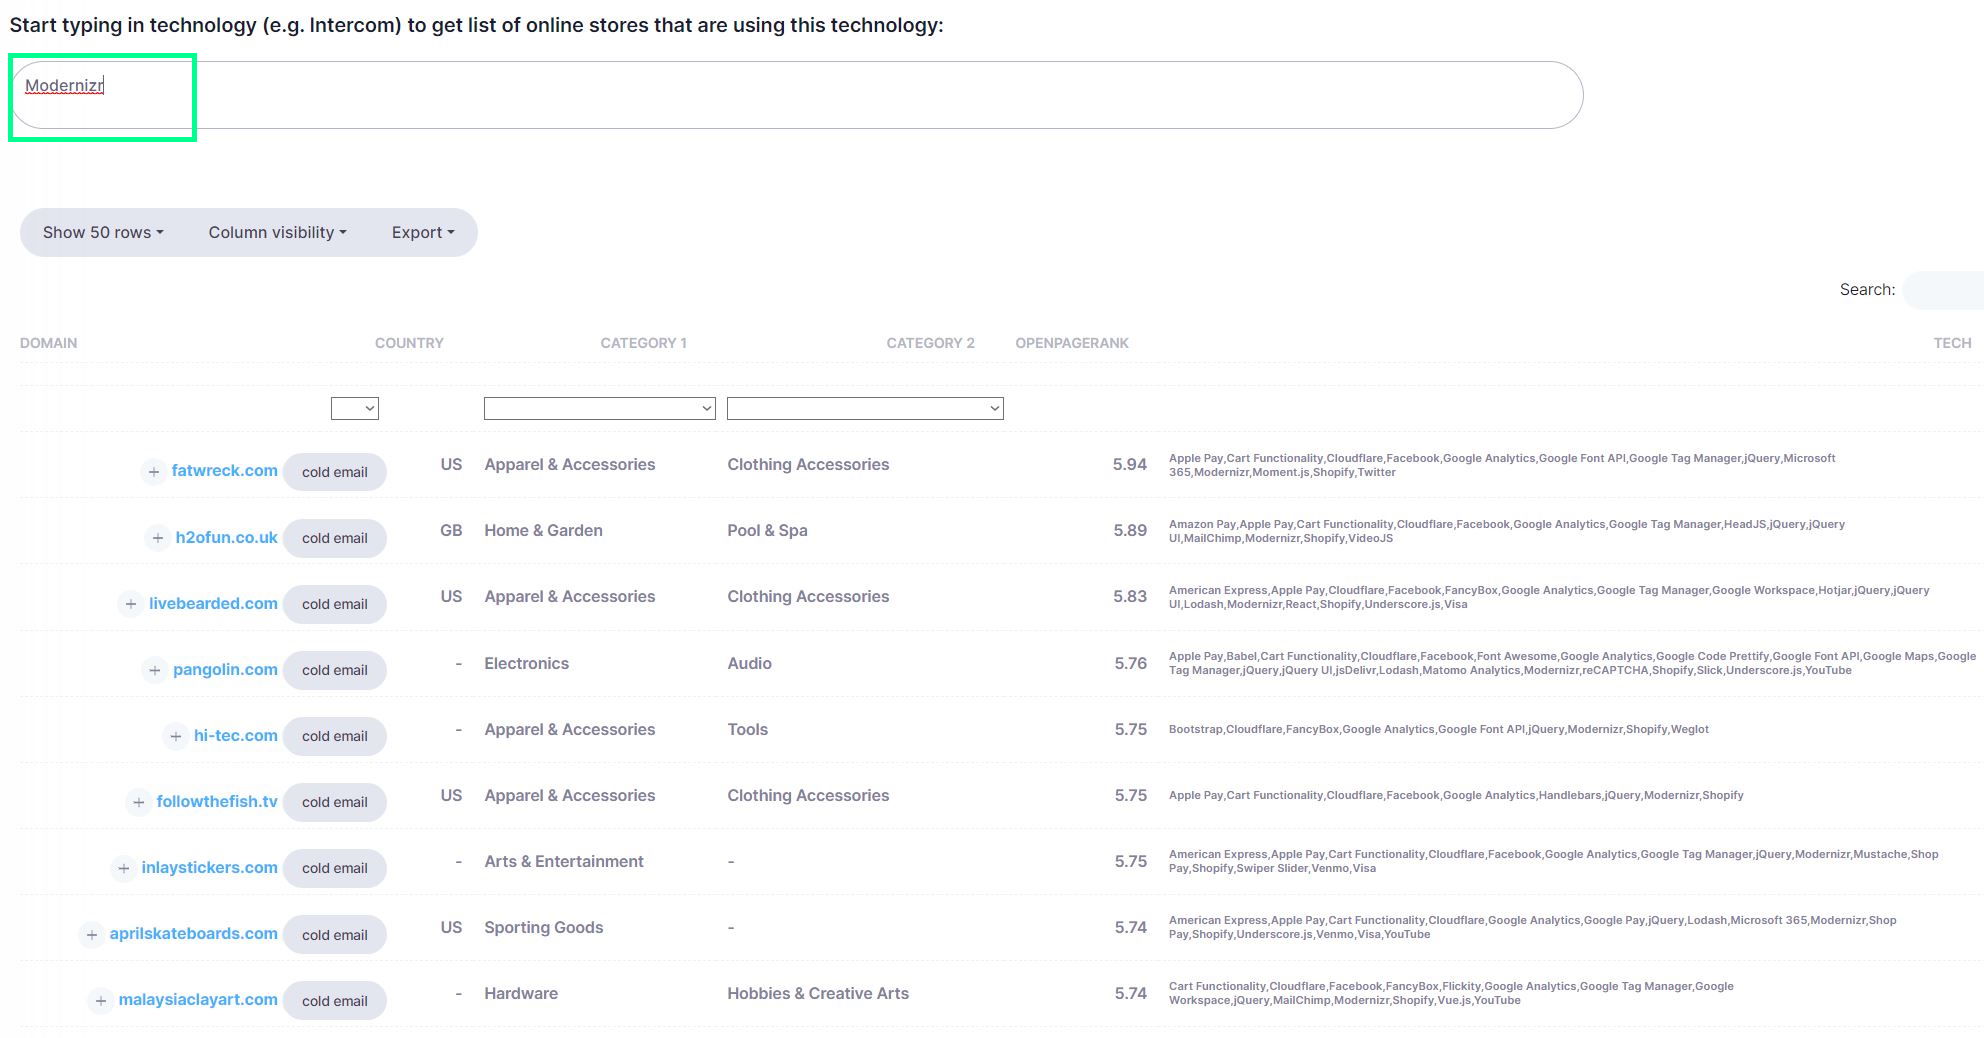
Stores using a technology
Stores using a chosen technology
Filters on technology results
Filters on the result table
06
Niche buildersInvestors

Research 5 million niche sites

The five million most popular websites, each placed in the IAB taxonomy, with authority, domain age and technologies.

Recipe A

Young sites gaining fast in Pets

  • Main category: Pets
  • Maximum domain age: 5 years
  • Order by authority
Recipe B

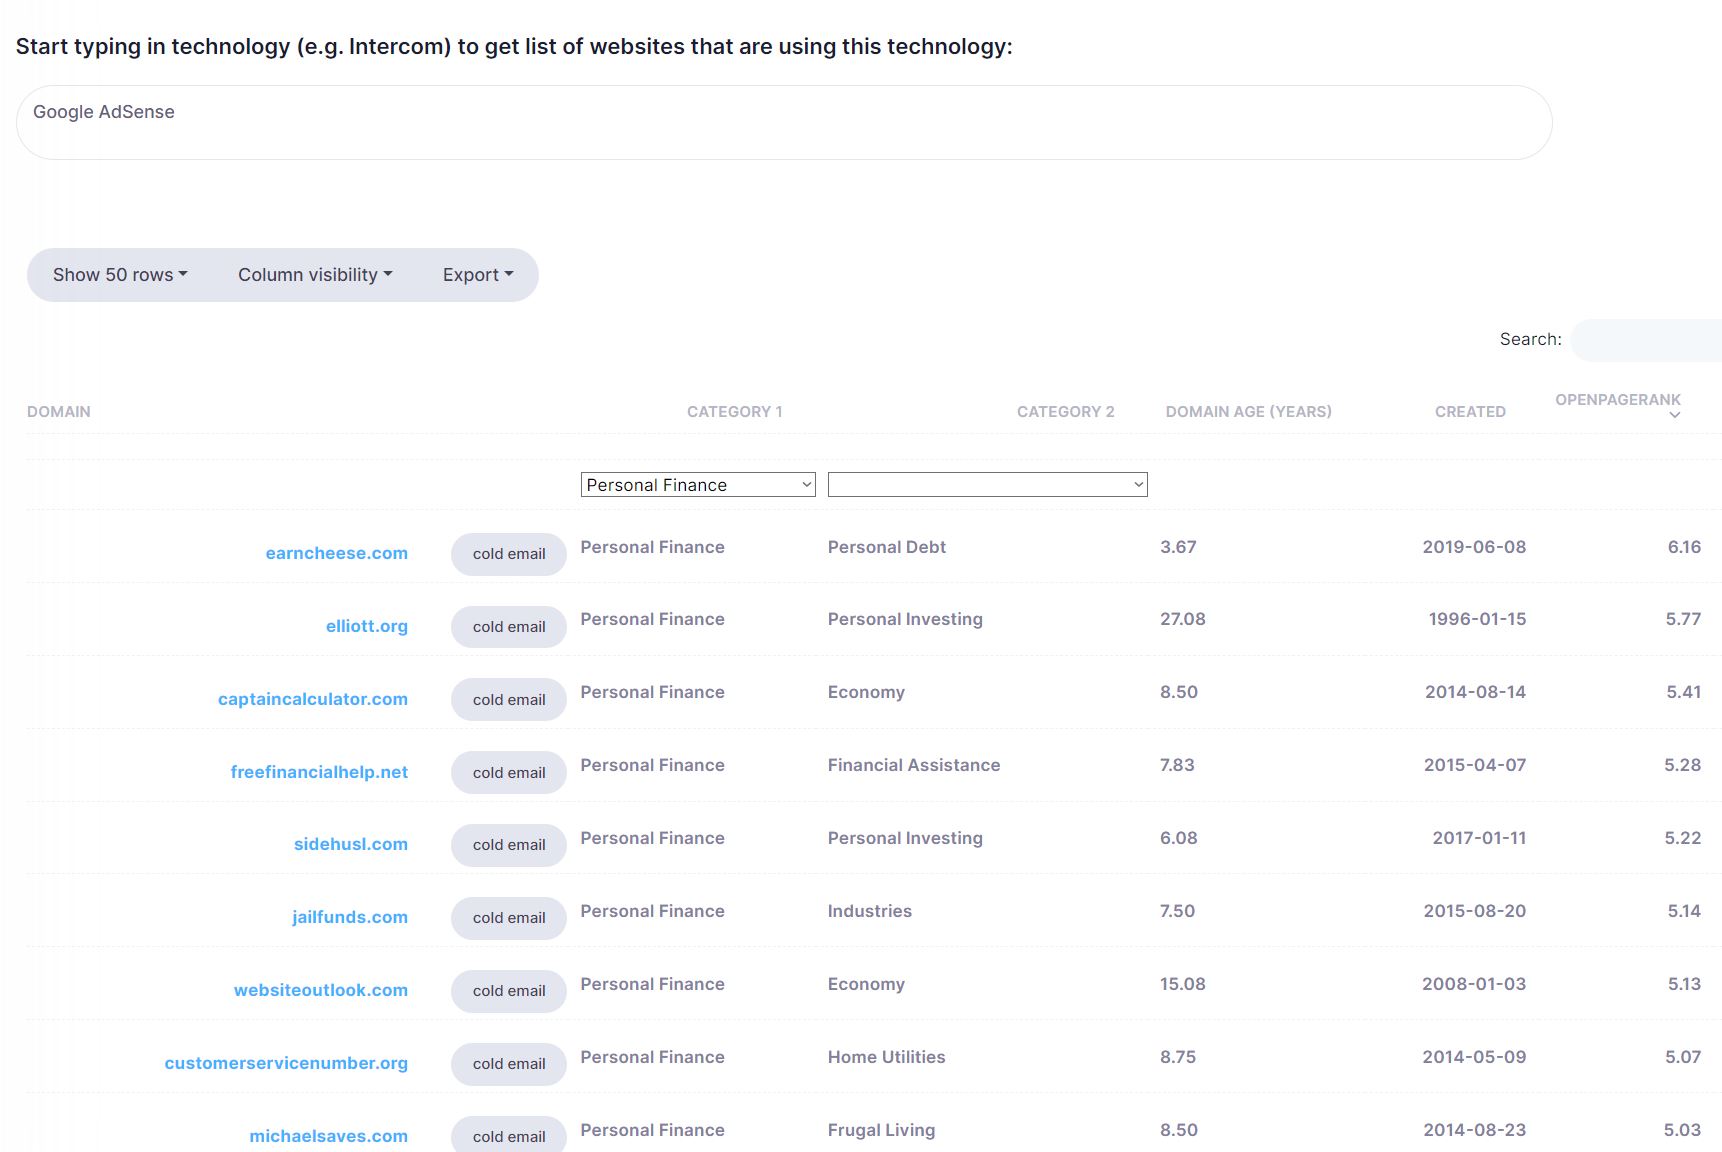
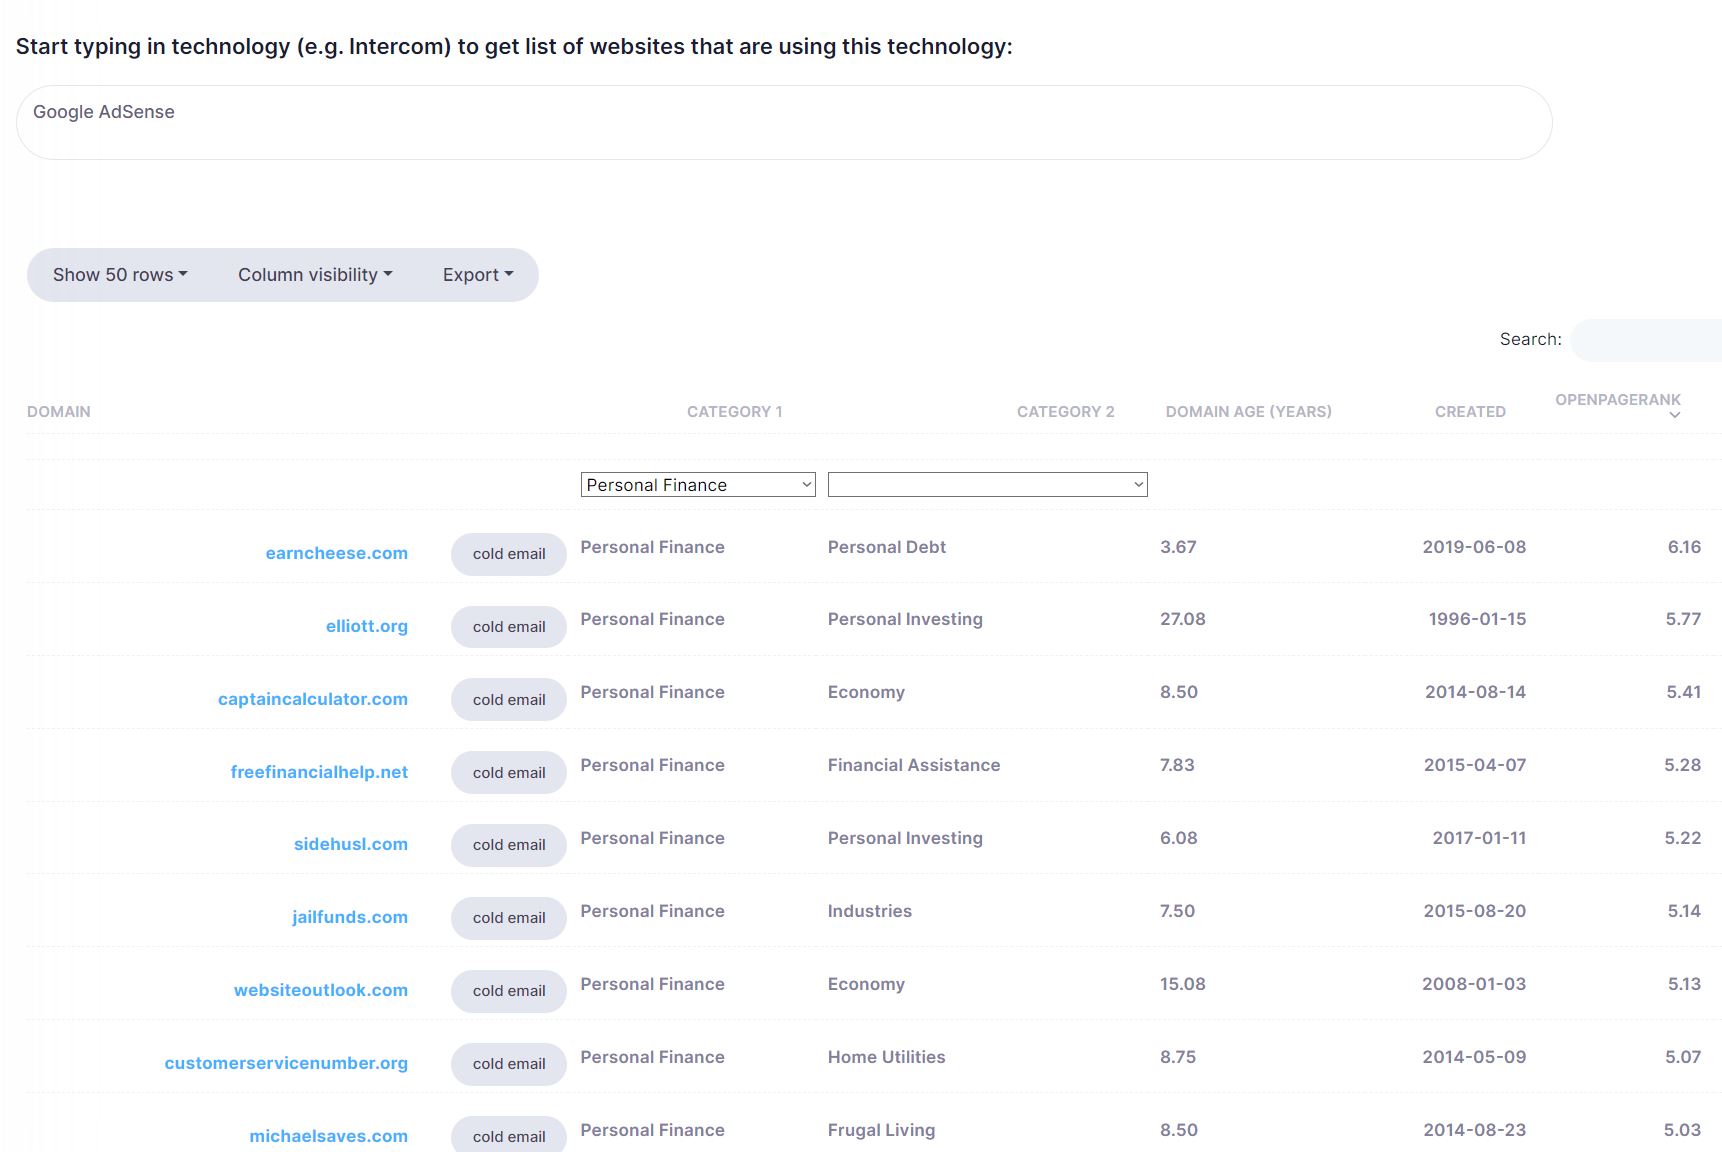
Monetized sites in Personal Finance

  • Technology: an ad network script
  • Category: Personal Finance
  • Then focus on young, high-authority rows

Run the same recipe on any of the other 439 categories, or export to Excel, Sheets or CSV for your own analysis.

Young Pets sites sorted by authority
Monetized Personal Finance sites
07
SaaS marketing

Find the verticals that over-use your technology, then get every site in them

Combine category data with technology data. Target the categories where your type of tool is used above average.

Pick your technology

Or the category leader you compete with.

Read the ratio chart

Categories above 1.0 are your natural market.

Add complements

The recommender names tools often used alongside yours.

Pull the list

Sites in strong categories, running complements, without your tool.

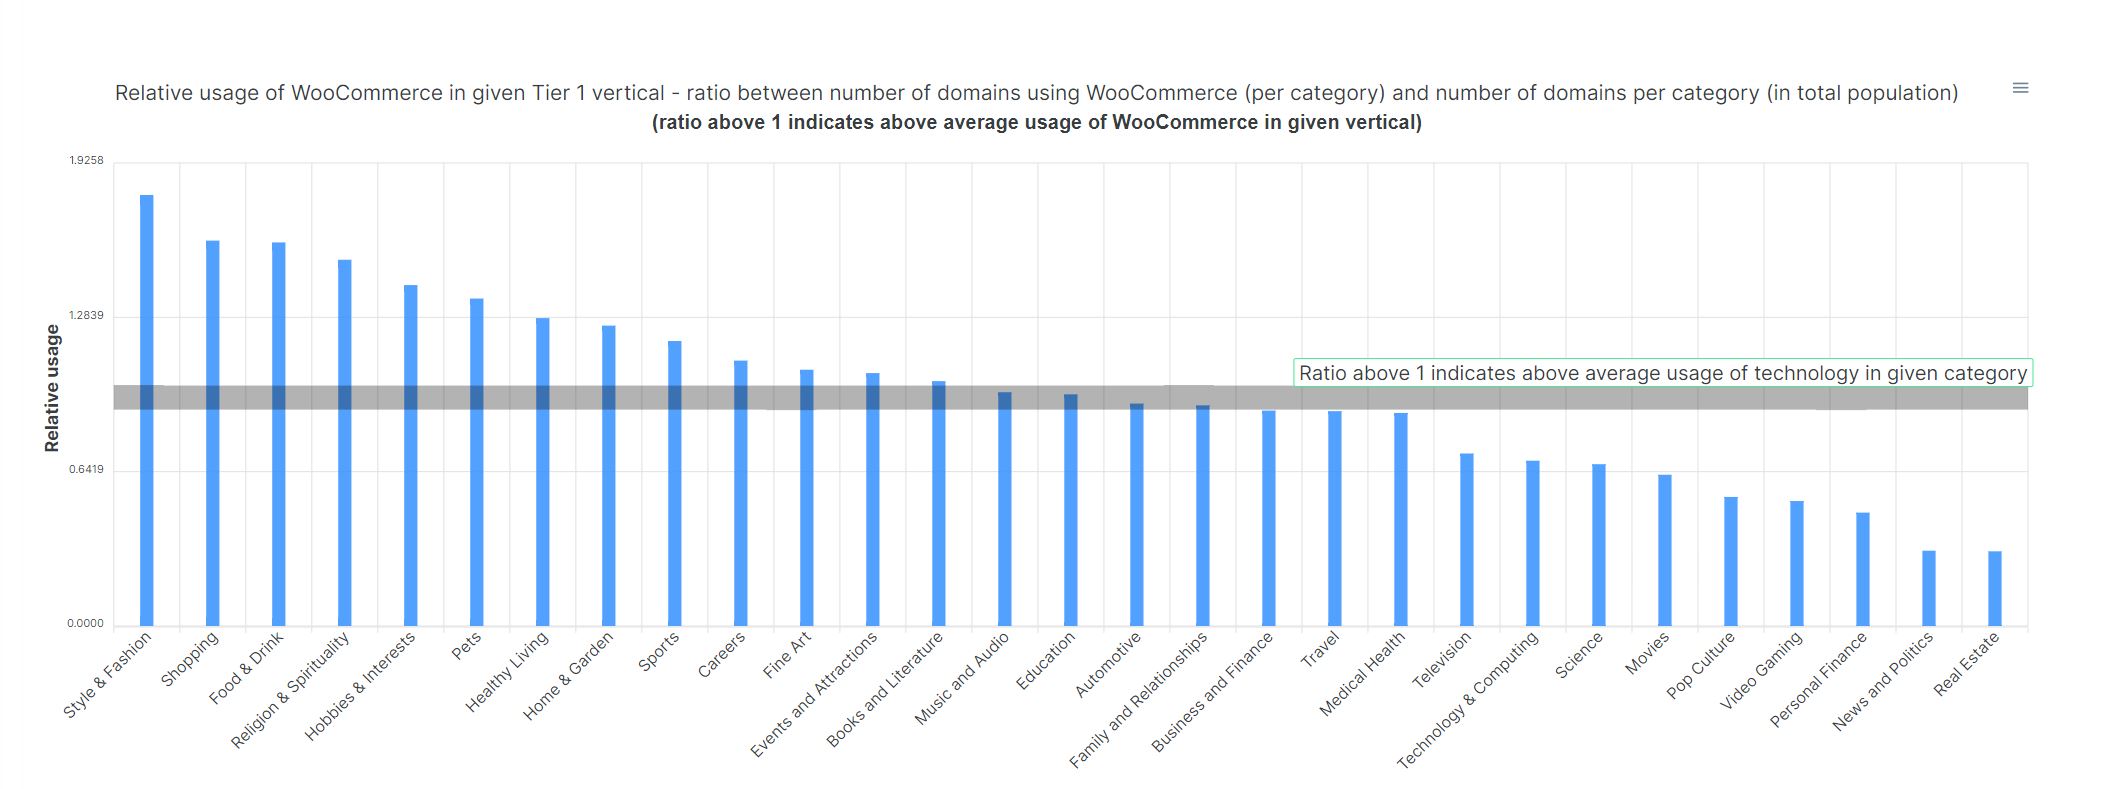
Example: WooCommerce

Style & Fashion, Shopping and Food & Drink lead. That matches what an ecommerce platform should show.

WooCommerce relative usage by category
Shopify relative usage by category
08
ProductStrategy

Get deep audience insight on any technology

Three more lenses on any technology: domain age, site popularity and country.

By domain age

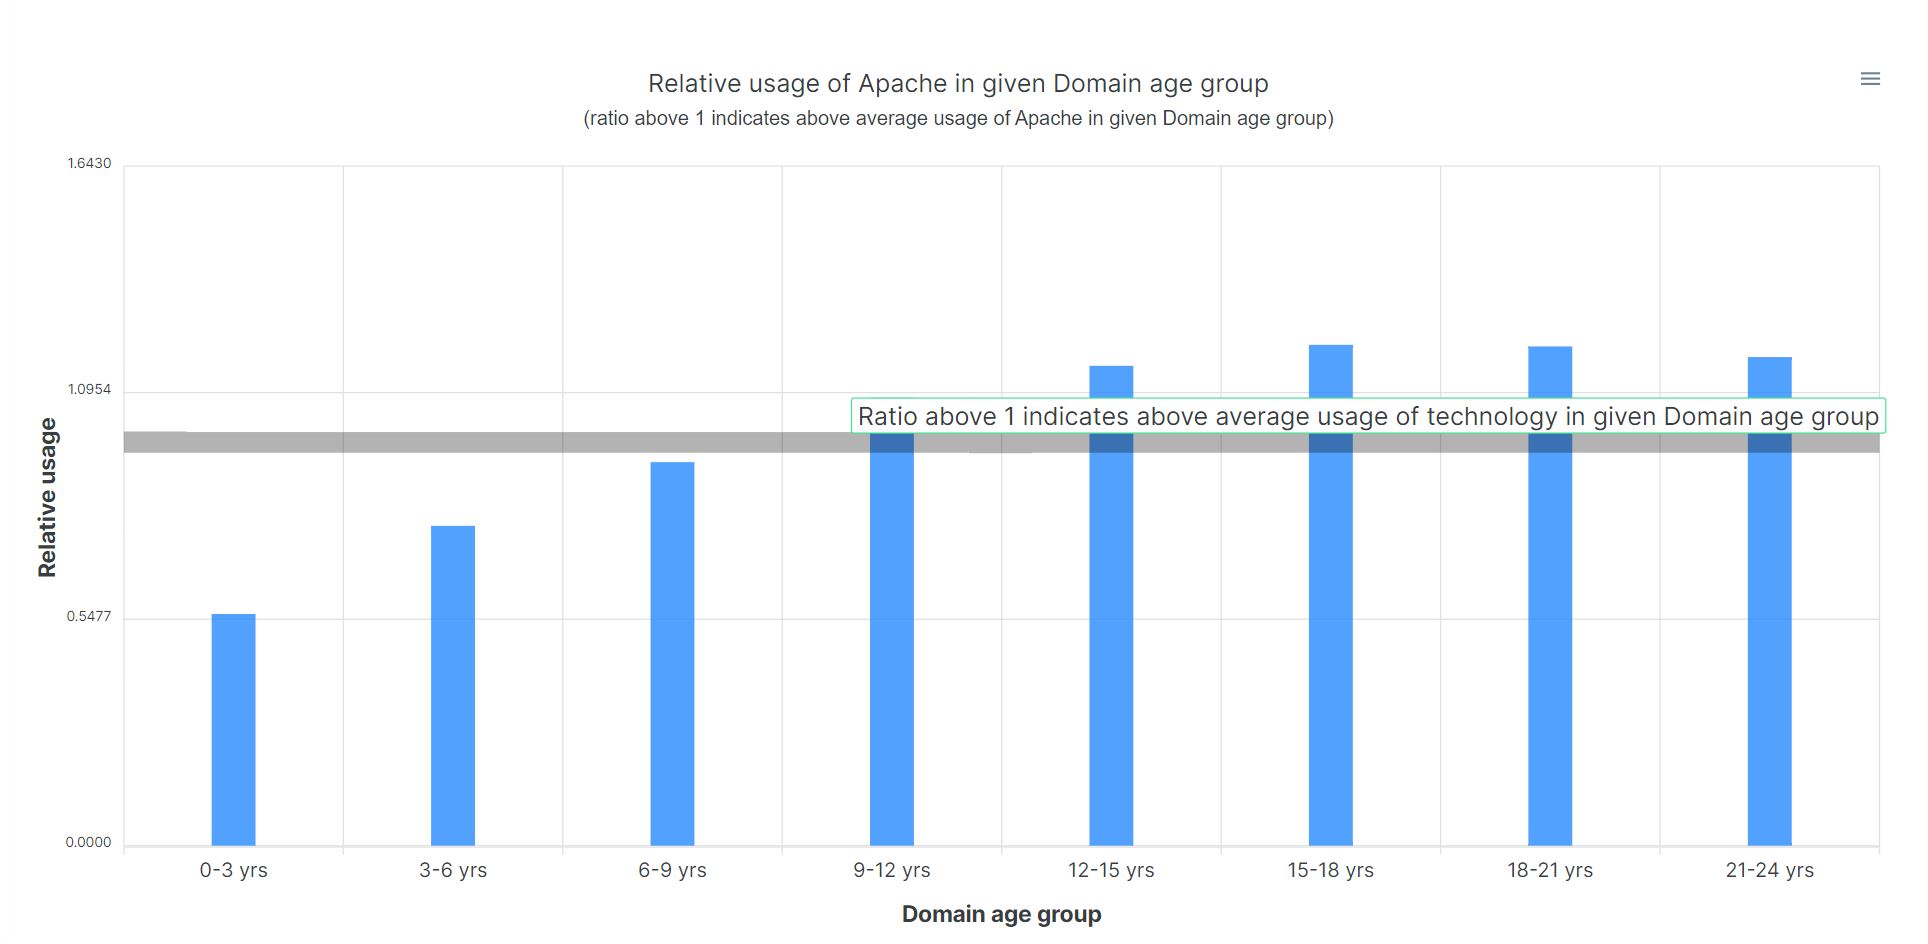
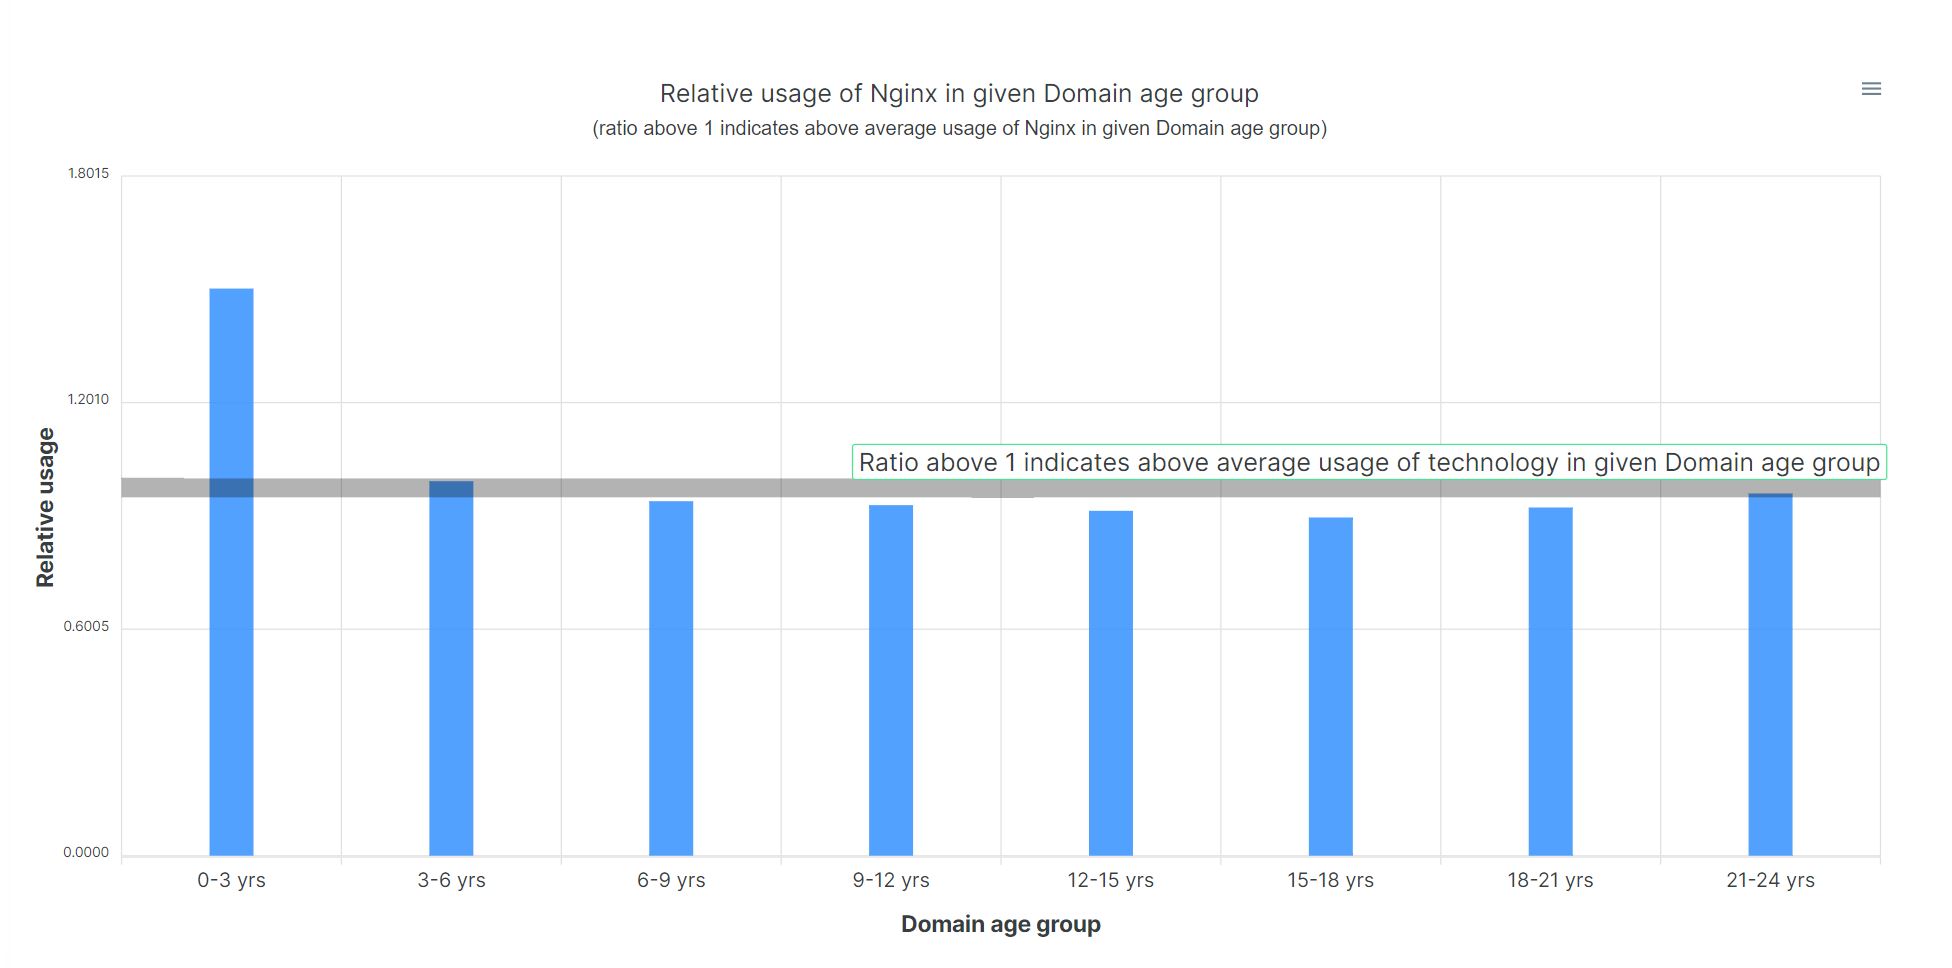
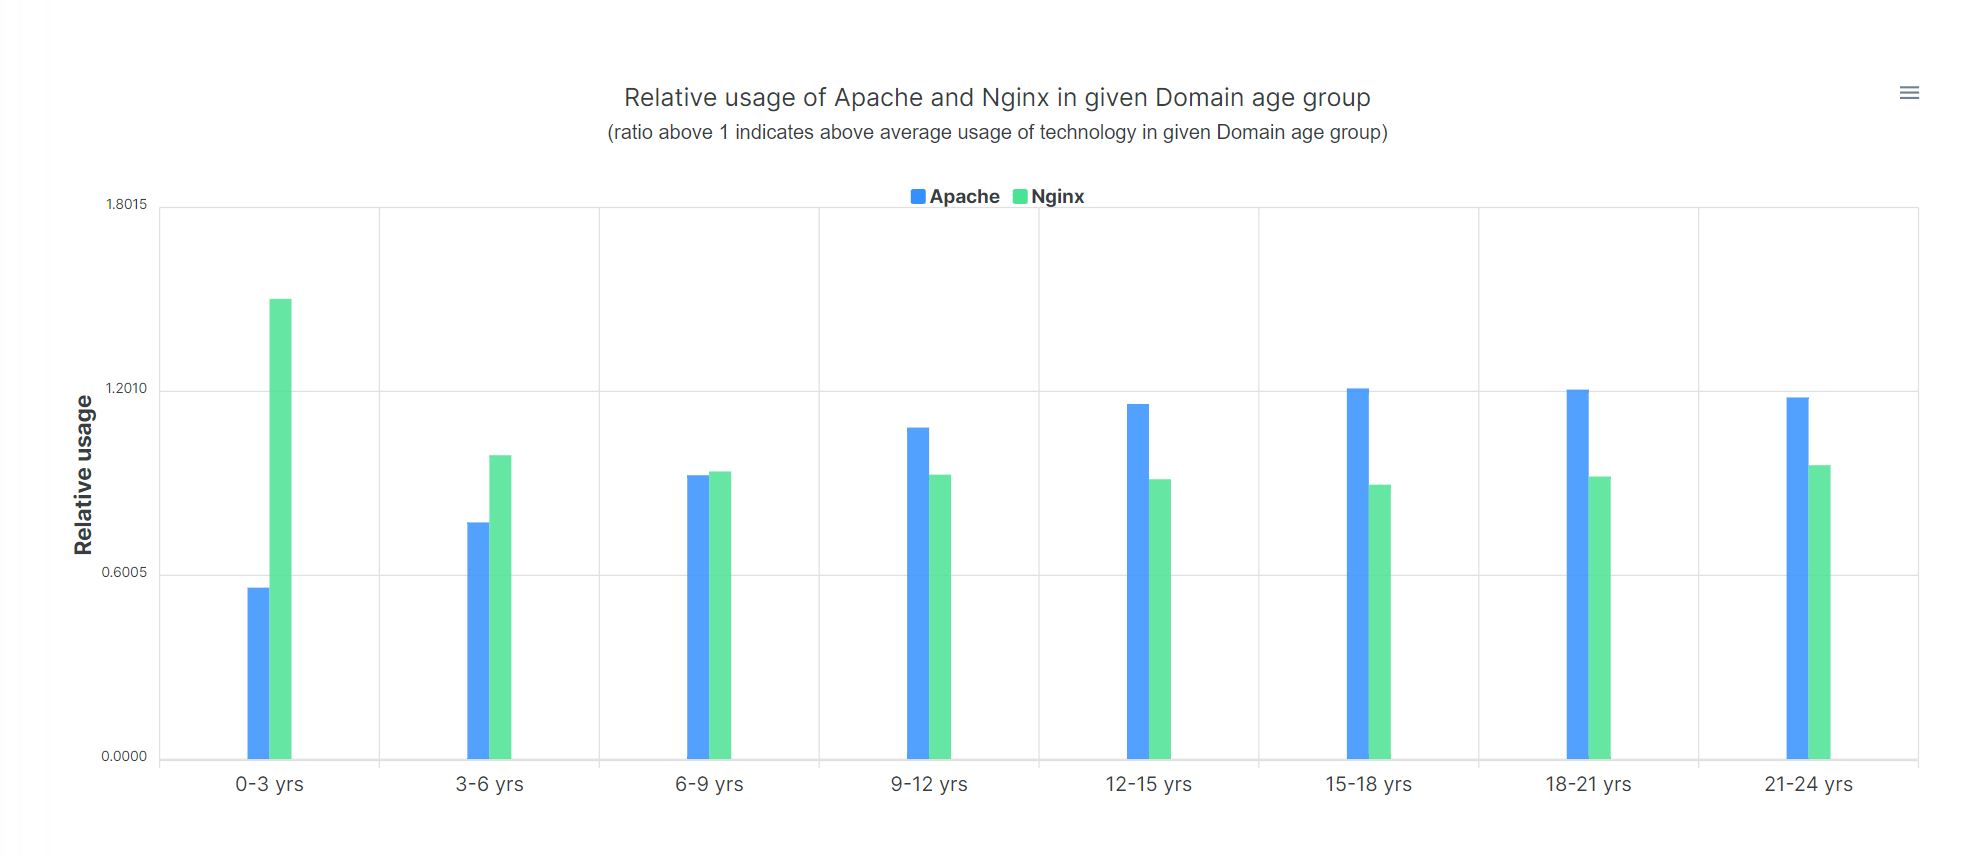
Apache skews to older domains, Nginx to younger ones. A rising tool wins the new sites first.

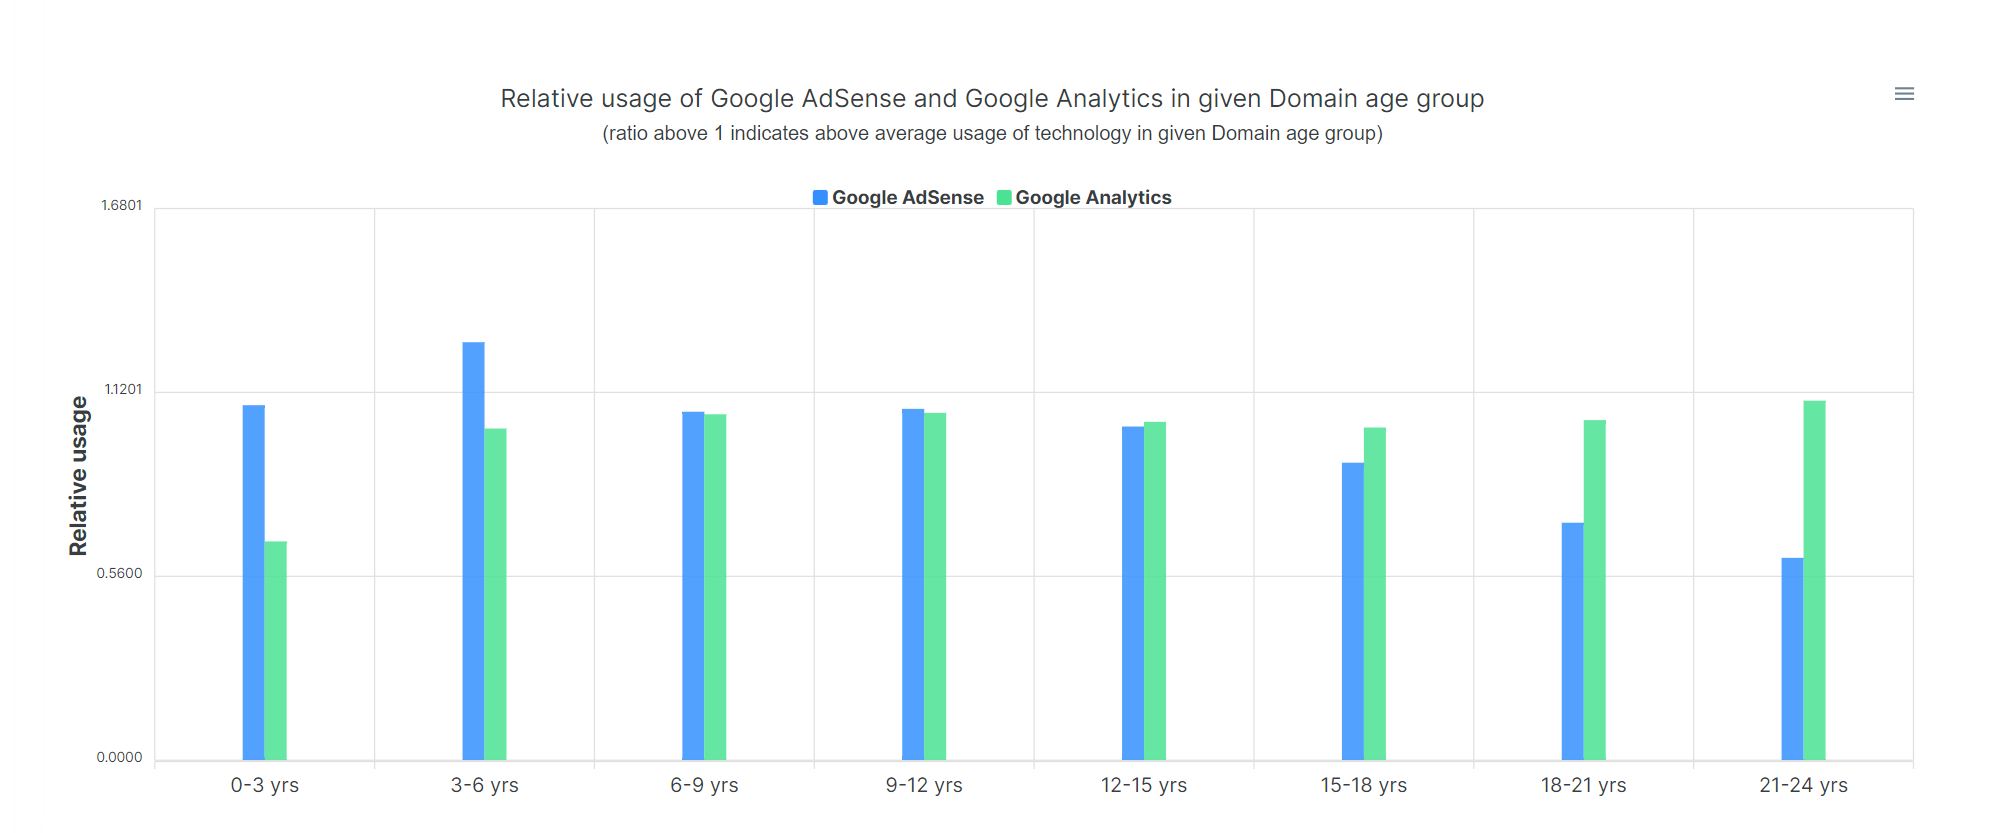
Analytics tools skew older; ad monetization skews younger.

By popularity tier

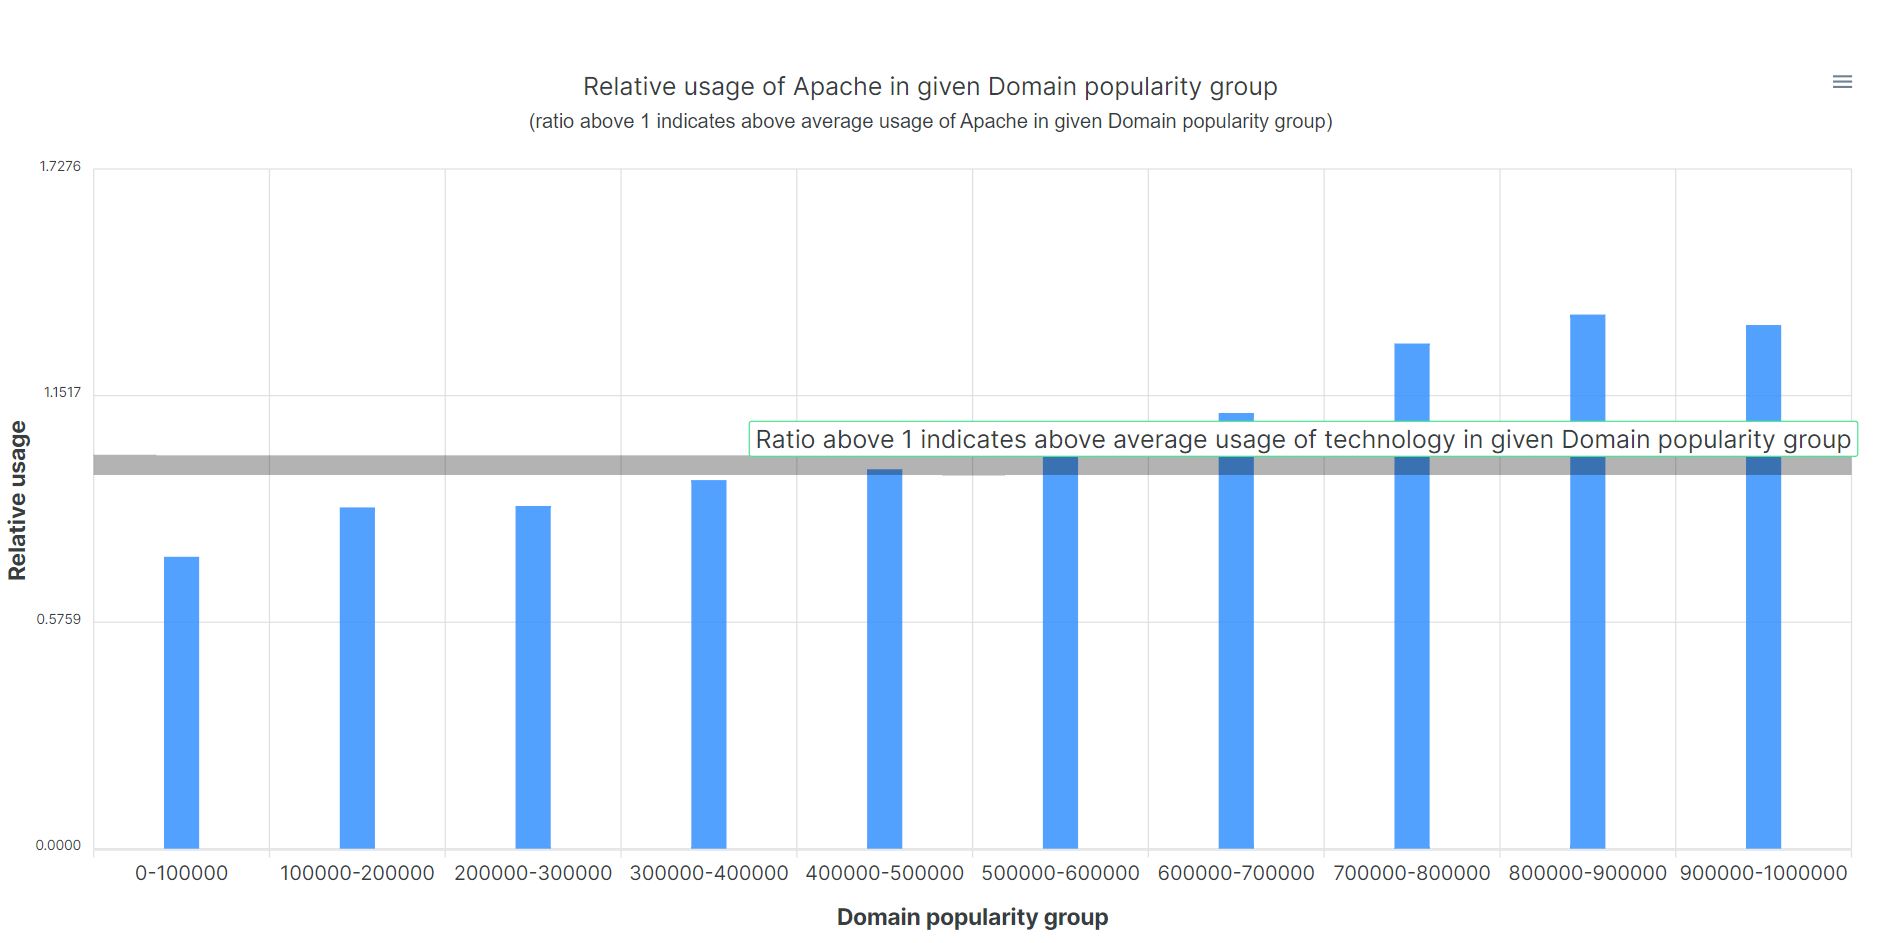
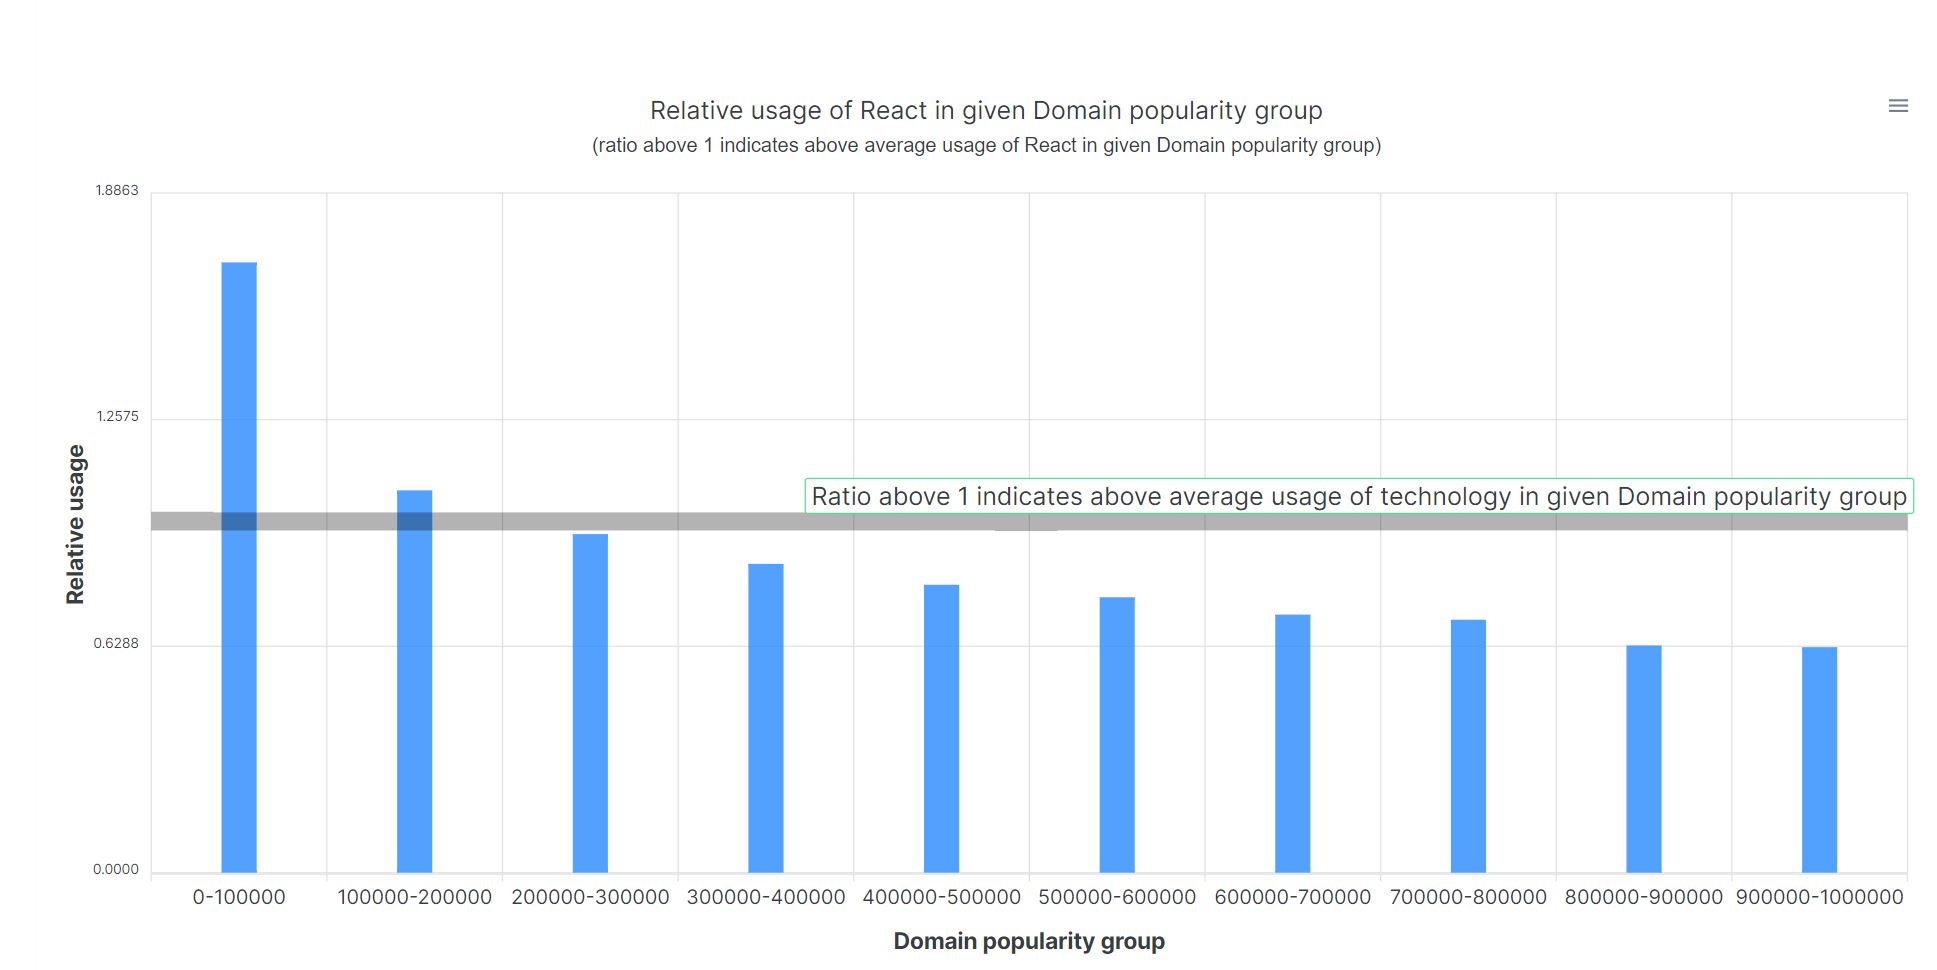
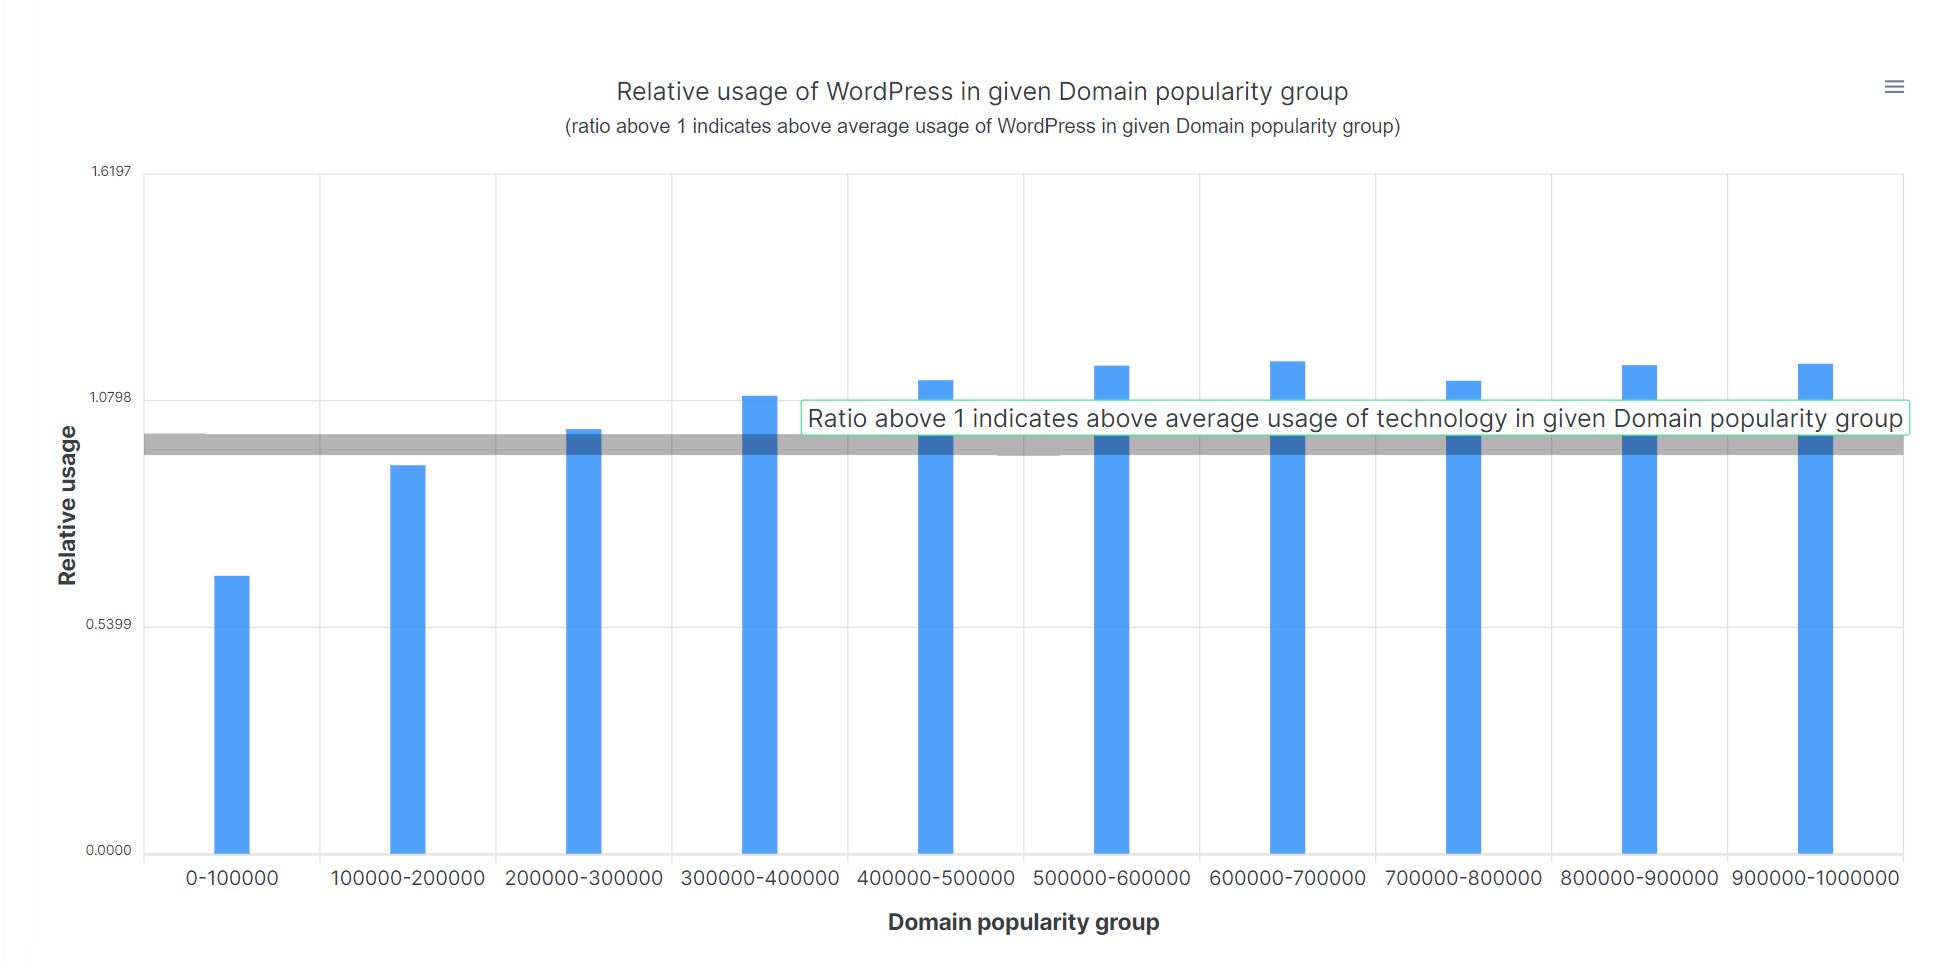
The top 1M sites in groups of 100,000. React peaks in the top tier and falls with rank.

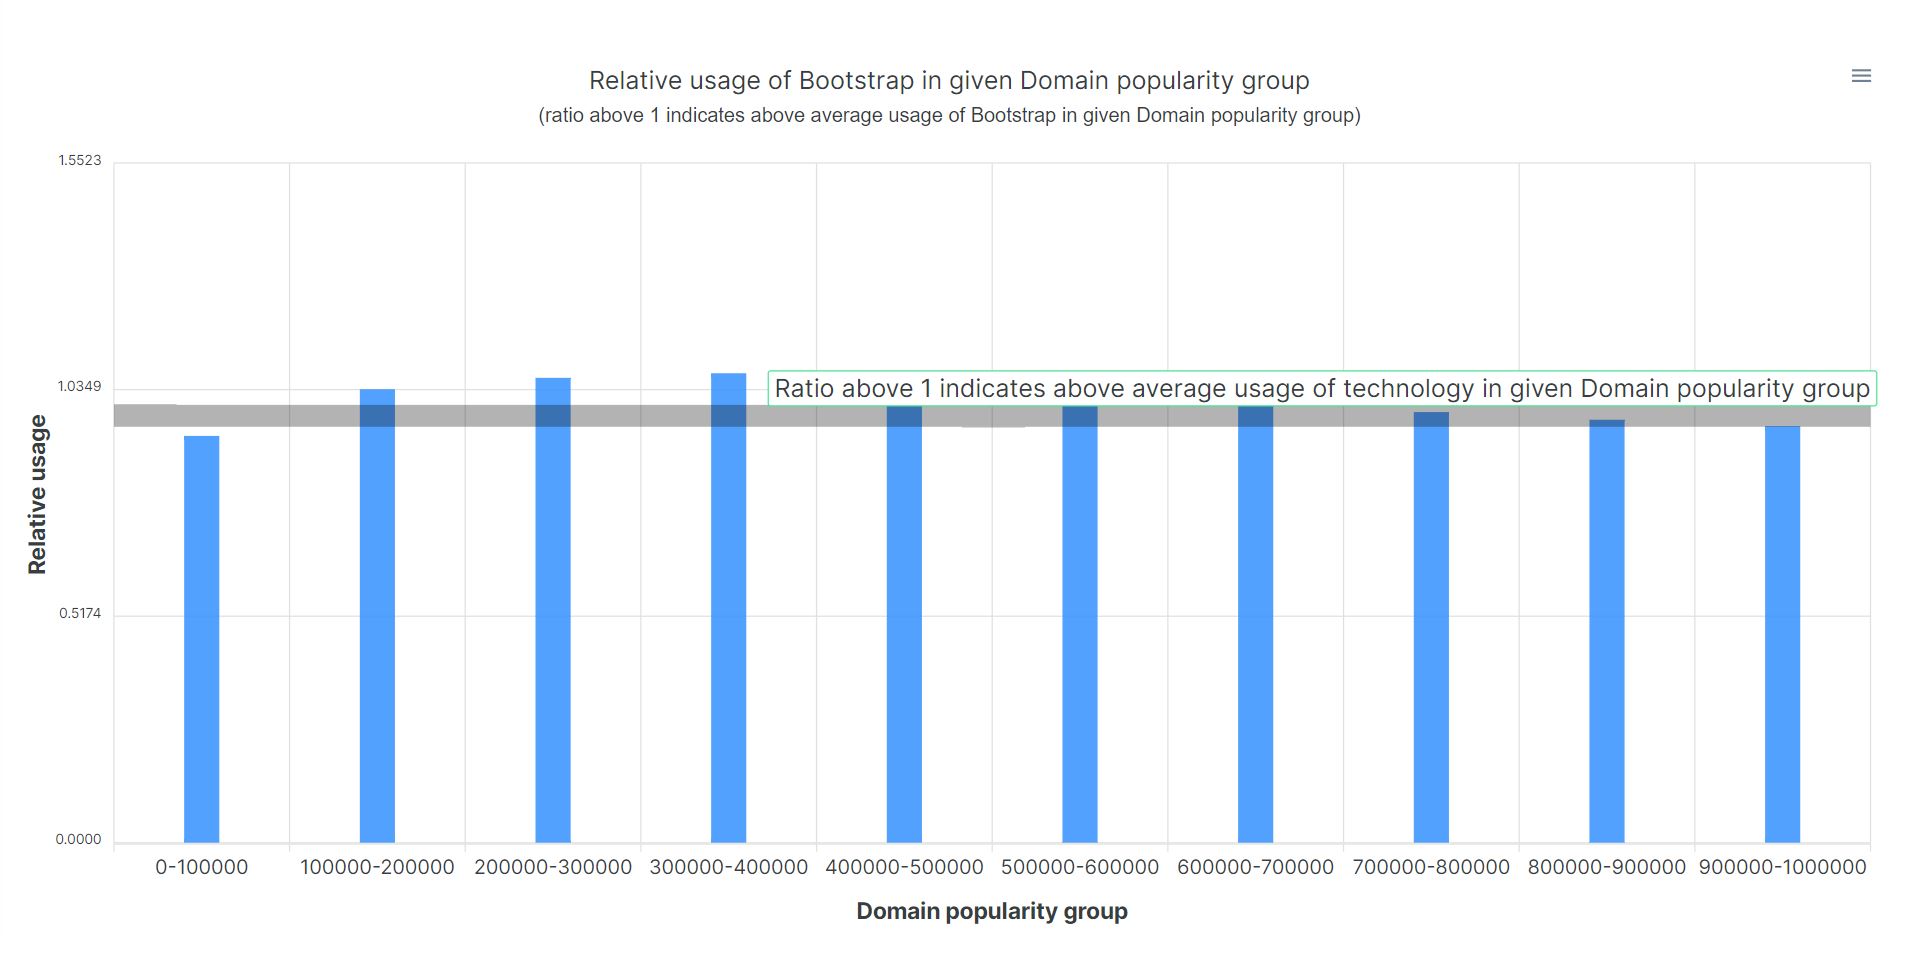
Bootstrap spreads evenly; Apache rises lower down.

By country

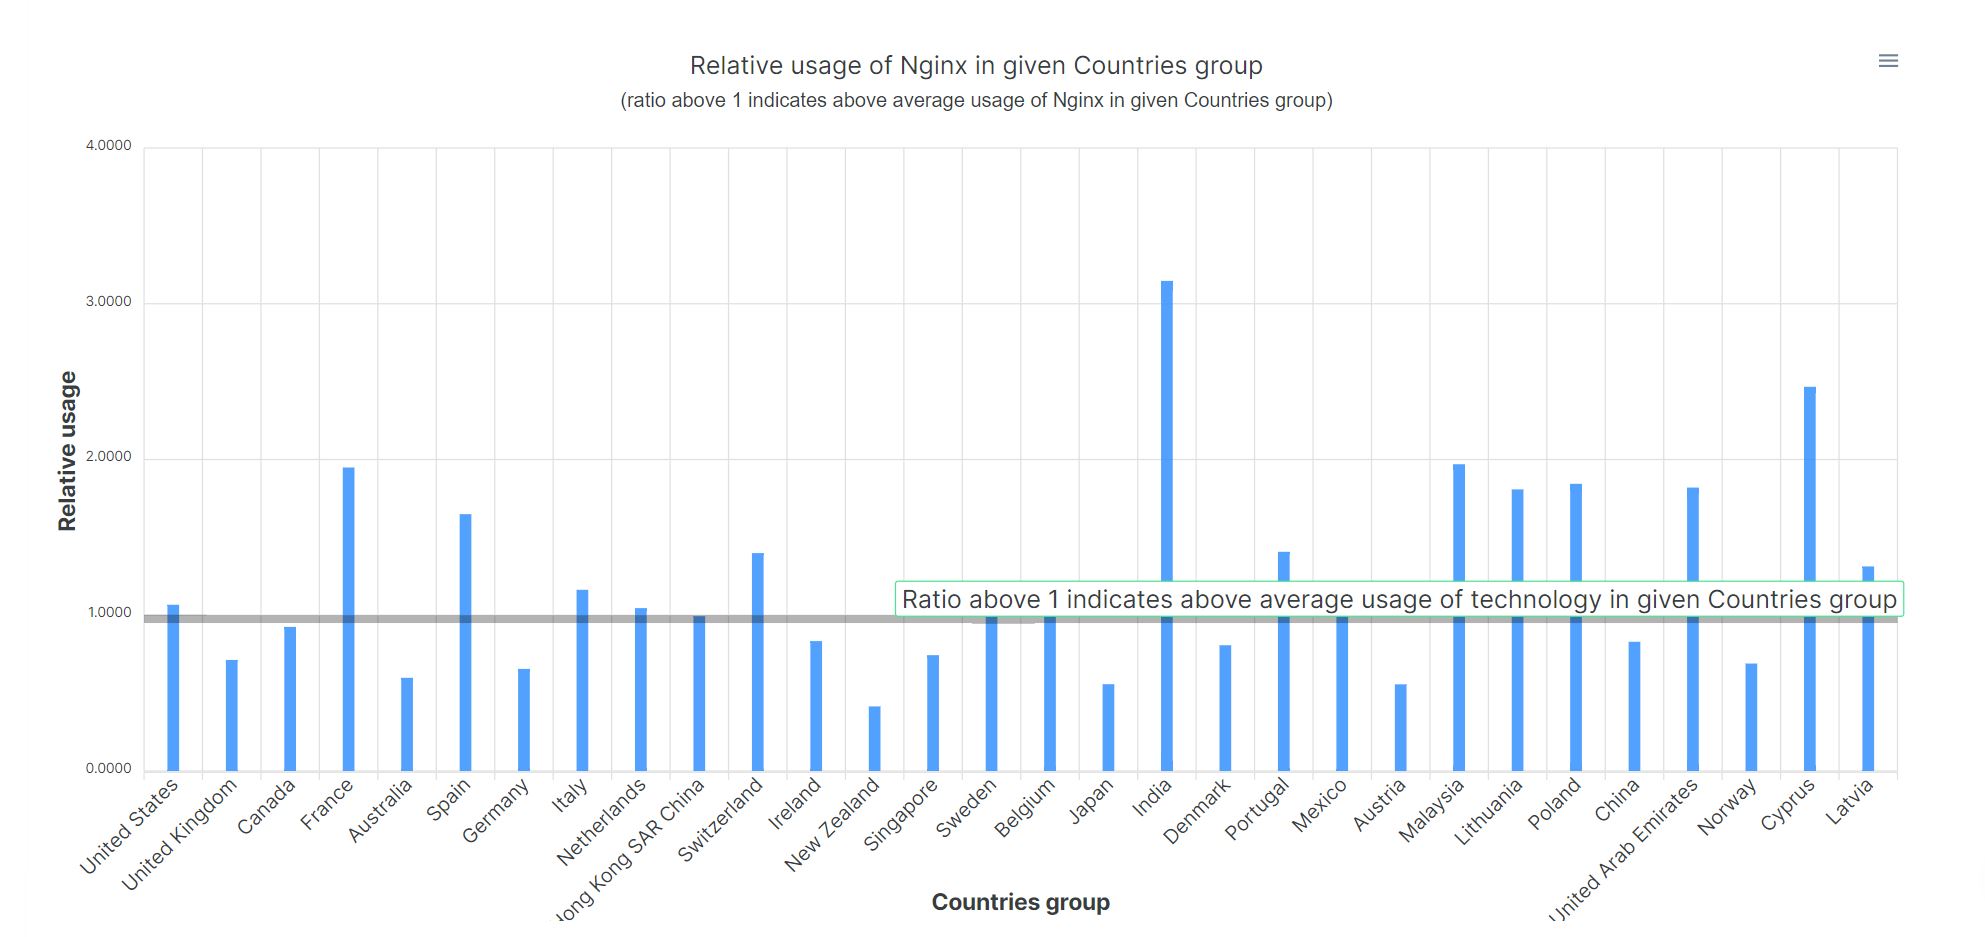
About 1 million stores carry a country. Nginx, for example, is very popular with stores in India.

Compare several at once

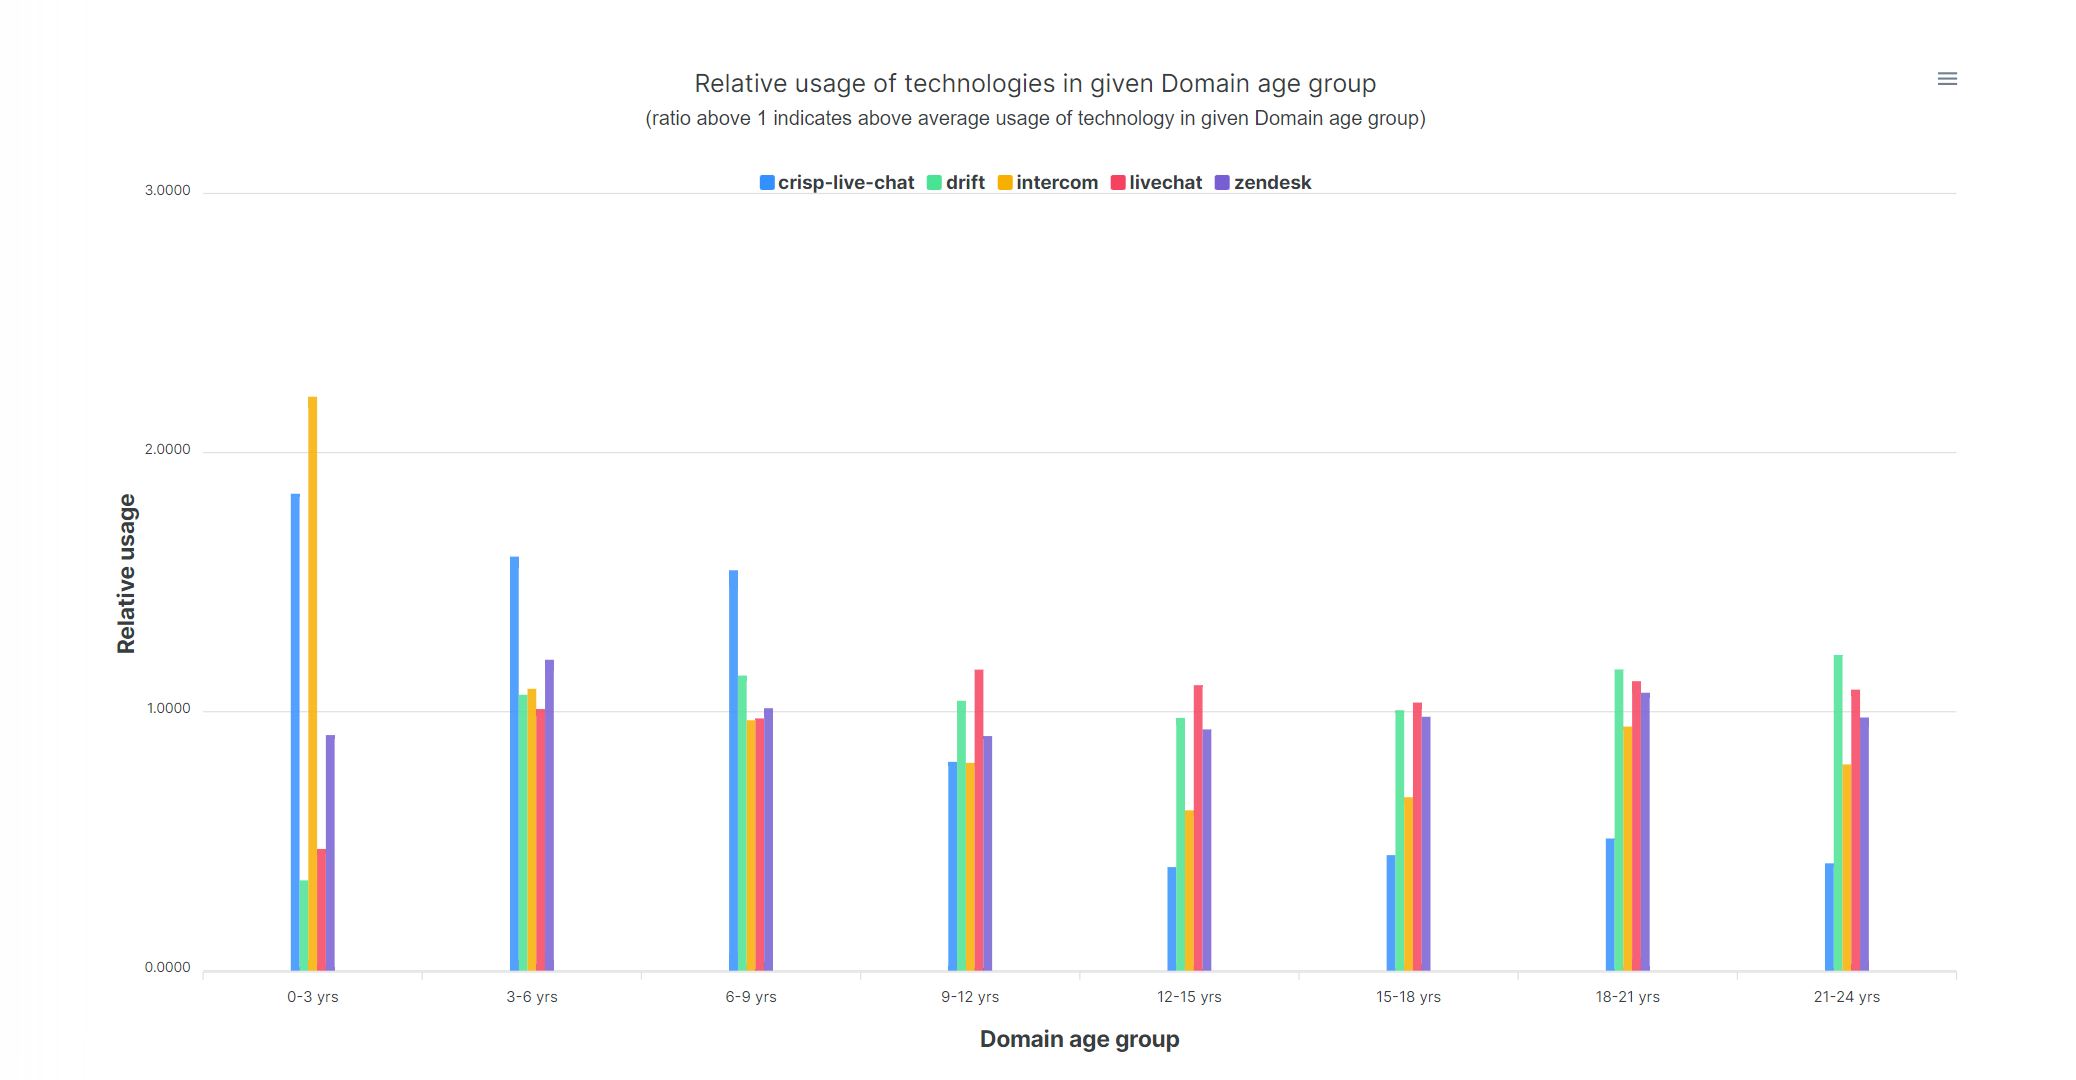
Put five live chat tools on one chart and spot audience gaps between you and rivals.

Apache by domain age
Nginx by domain age
Nginx by domain age
Apache and Nginx compared
Two web servers compared
Five live chat tools compared
Five live chat tools on one chart
Analytics versus ad monetization by age
Analytics versus ad monetization by domain age
Apache by popularity tier
React by popularity tier
Bootstrap by popularity tier
WordPress by popularity tier
Nginx by store country
09
SEOStore owners

See which product groups are least difficult to rank for

For every one of 60,000 product keywords we measure the average authority of the top ten ranking sites. Low means beatable.

Hardest in Electronics

androidiphonekindlemacbookipadgamingdronesgopronintendo switchsmart devices

Easiest in Electronics

price computing scalessurveillance kitsradio holderspecial effects lightingbattery trayphone popperwhip mount
Product groups sorted by ranking difficulty
Electronics product groups sorted by ranking difficulty
10
Store ownersBrands

Find viral and trending product groups

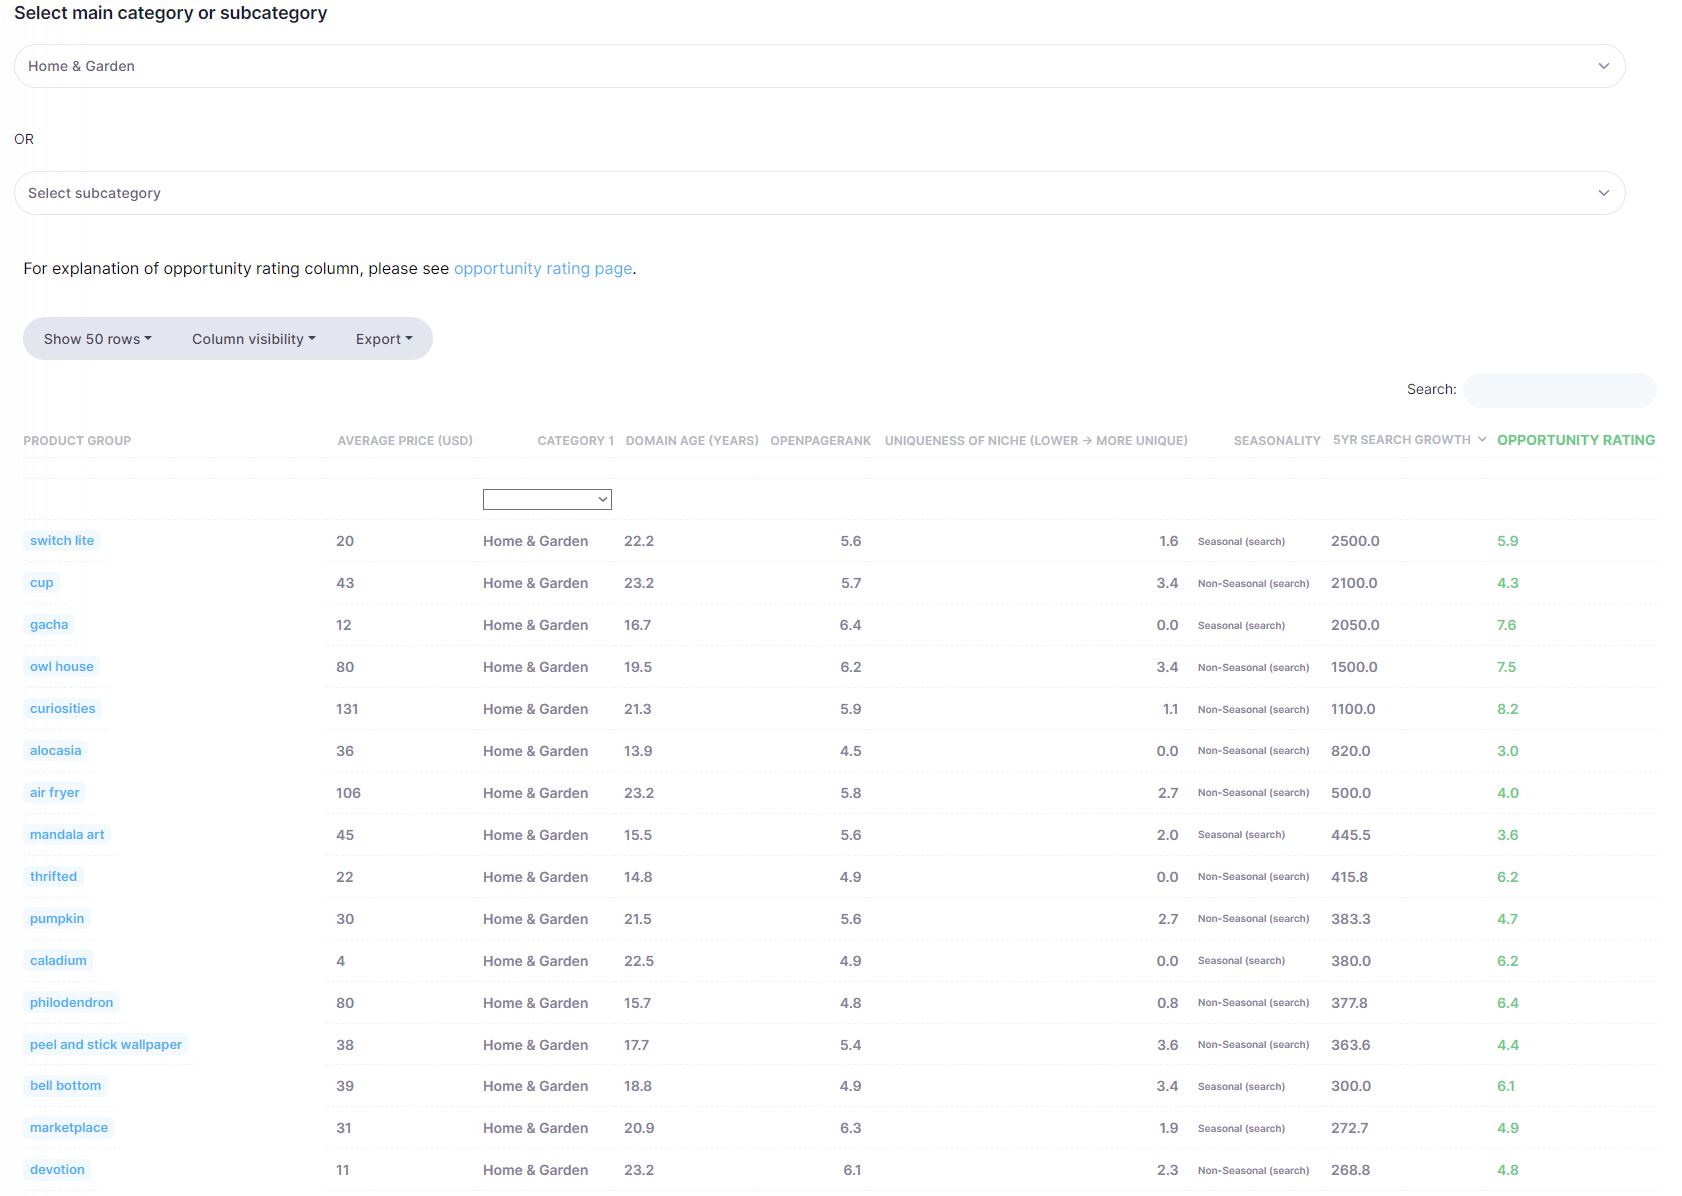
Each of about 60,000 product groups carries a 5-year search trend. Sort descending inside any category.

Home & Garden, sorted by 5-year trend

The top of the list shows what buyers want more of every year.

owl houseair fryerpeel and stick wallpaperhot water bottlesdehumidifiertrellisesair purifier

Trending products page →

Home and Garden product groups sorted by trend
Home & Garden by 5-year trend
11
PublishersAd sales

Find the top ad-monetized sites by niche

Pick an ad technology, list every site running it, filter by category. Personal Finance alone returns many thousands.

  • 440 categories to repeat the same filter on.
  • Row count depends on your plan.
  • Export to CSV, Excel or PDF for outreach or analysis.

Ad-monetized websites page →

Ad monetized Personal Finance sites
Ad-monetized Personal Finance sites
12
Customer success

Churn prevention: find the customers most likely to leave

Two independent signals tell you which accounts need attention first.

Signal 1

Category fit

Customers in categories that use your type of tool far below baseline are less anchored to it.

Shopify example: Style & Beauty is about 8 times baseline, Books & Literature sits below it.

Signal 2

Stack fit

The recommender spots when your tool is unlikely to sit alongside a customer's other tools.

Output: your customers ranked by churn likelihood.

Category ratios for churn
Tier 1 category ratios
Tier 2 category ratios for churn
Tier 2 ratios, top 50 of 440
Go deeper

See churn prediction.

Run these workflows on your own market

Both plans include all twelve workflows. Enterprise adds larger reports and more seats.